Code Analysis#
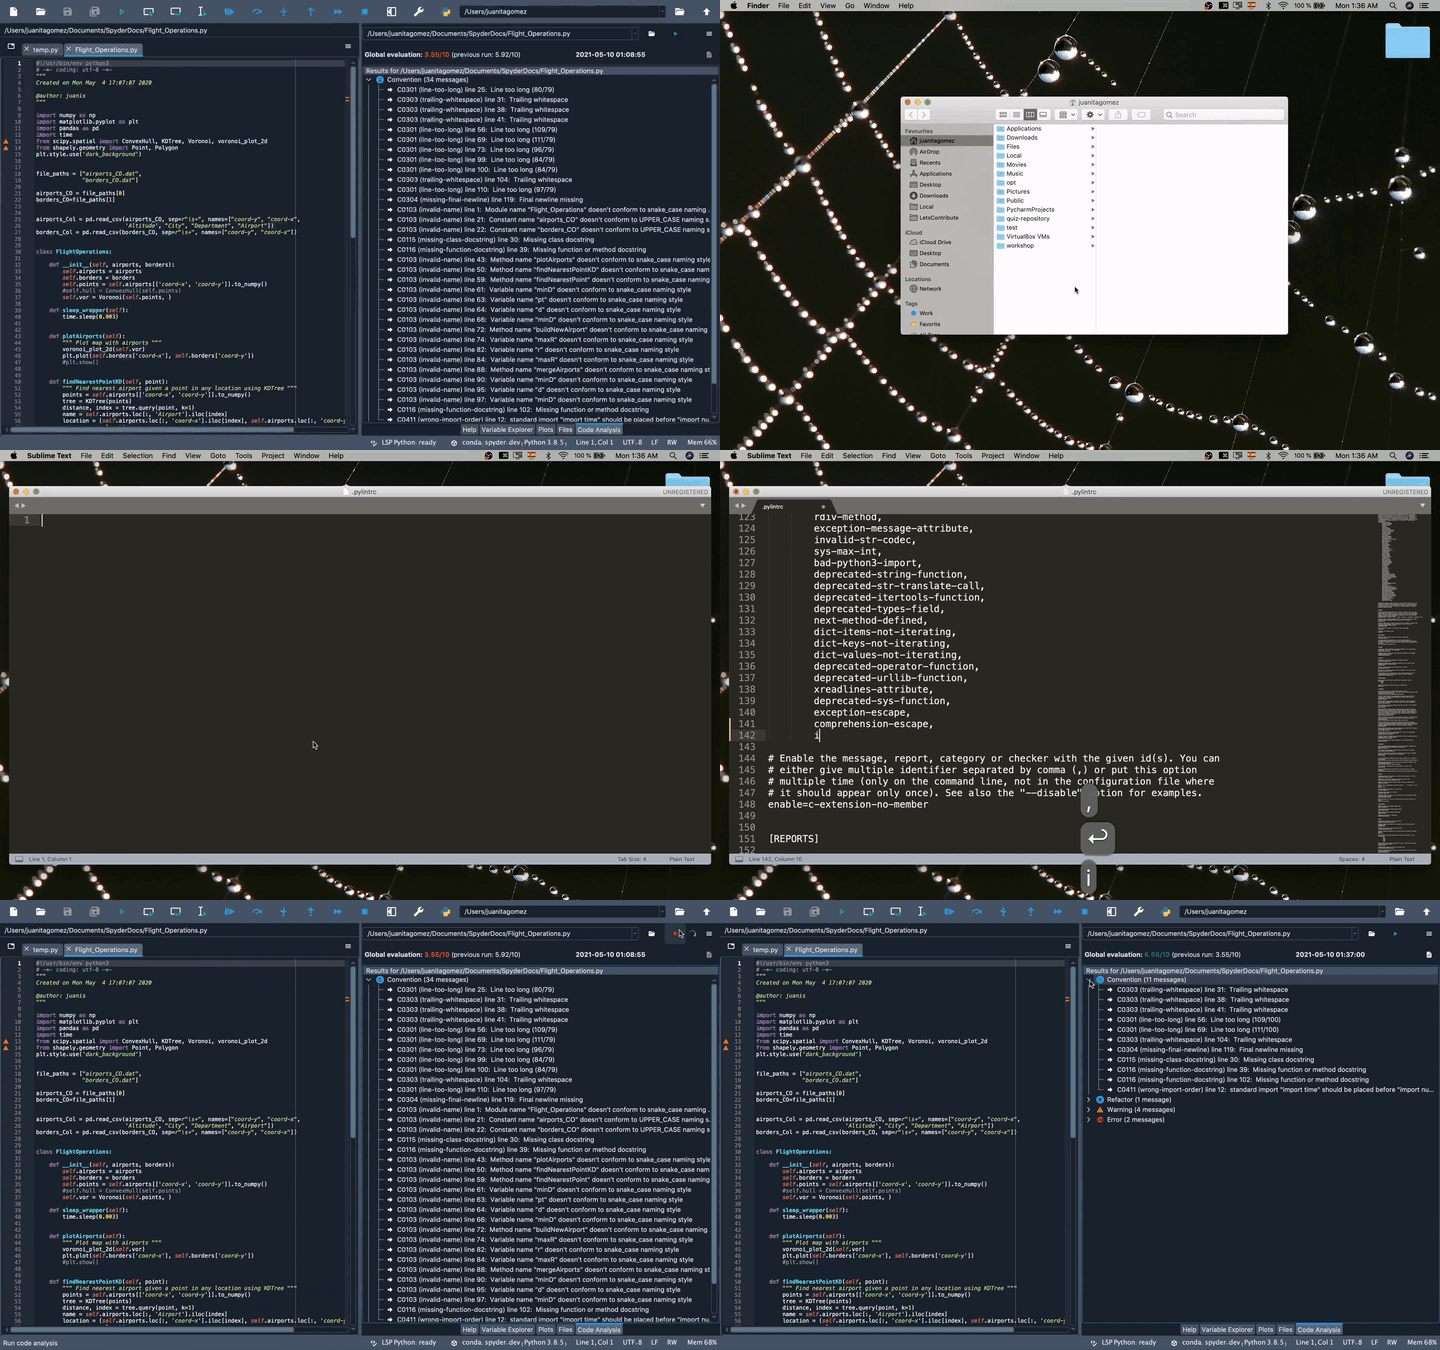
The Code Analysis pane detects style issues, bad practices, potential bugs, and other quality problems in your code, all without having to actually execute it. Based on these results, it also gives your code an overall quality score. Spyder’s code analyzer is powered by the Pylint backend, which can intelligently detect an enormous and customizable range of potential errors, bad practices, quality issues, style violations, and more.
Using the code analyzer#
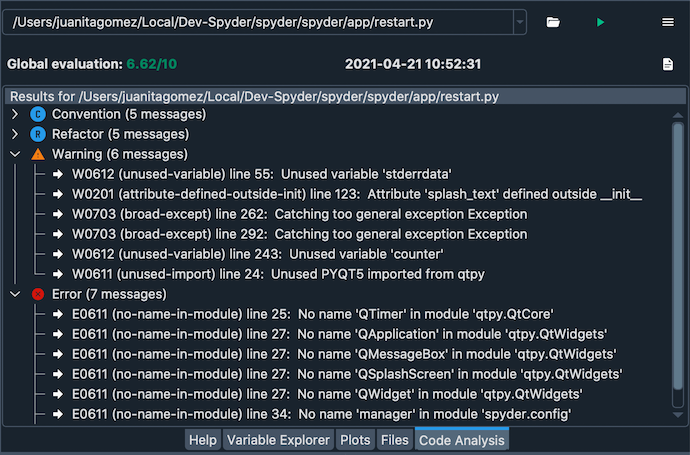
To select the desired file to analyze, make sure it is focused in the Editor by clicking anywhere within it. Then, the run the analysis, press the configurable shortcut (F8 by default), select from the menu bar or click the Analyze button in the Code Analysis pane. If the Code Analysis pane is not visible, you can open it under . All standard checks are run by default. Click any detected issue to go directly to the line with the failed check in the Editor.
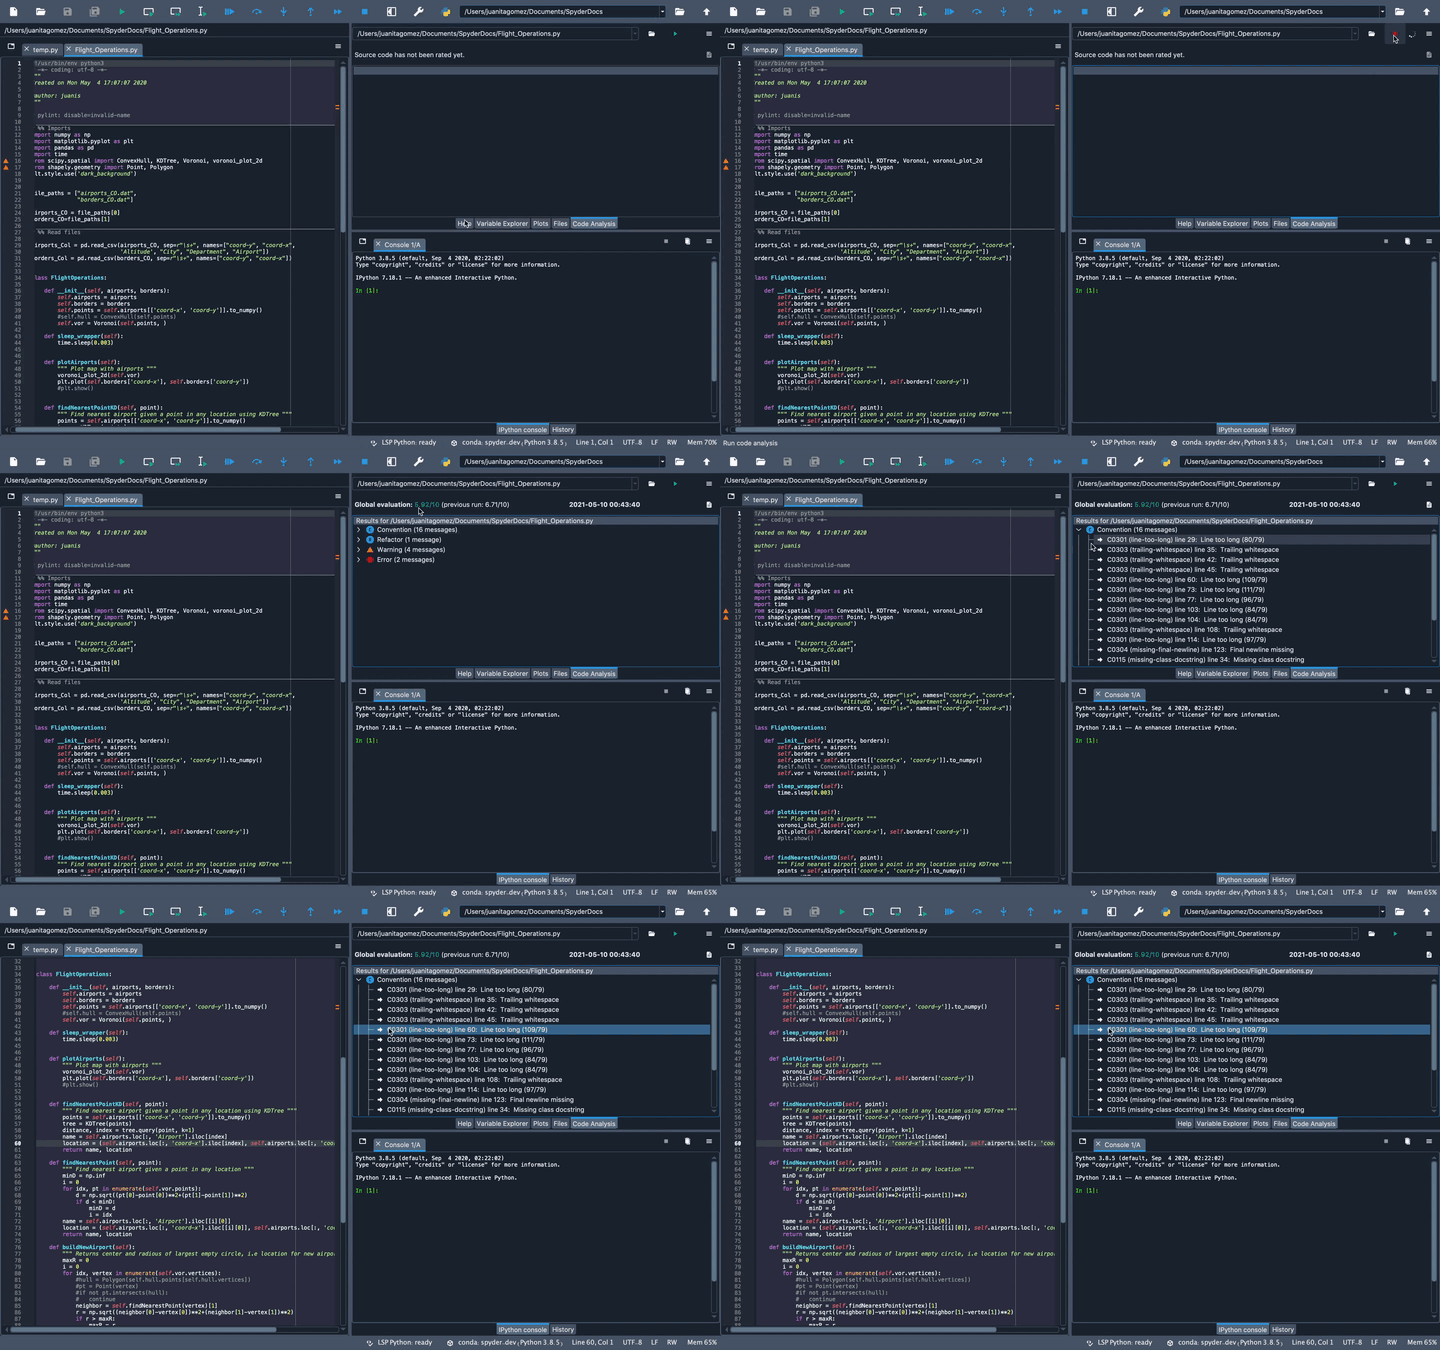
You can also manually enter the path of a file you’d like it to check in the path entry box in the pane’s toolbar, which works with both individual scripts and whole Python packages (directories containing an __init__.py file).
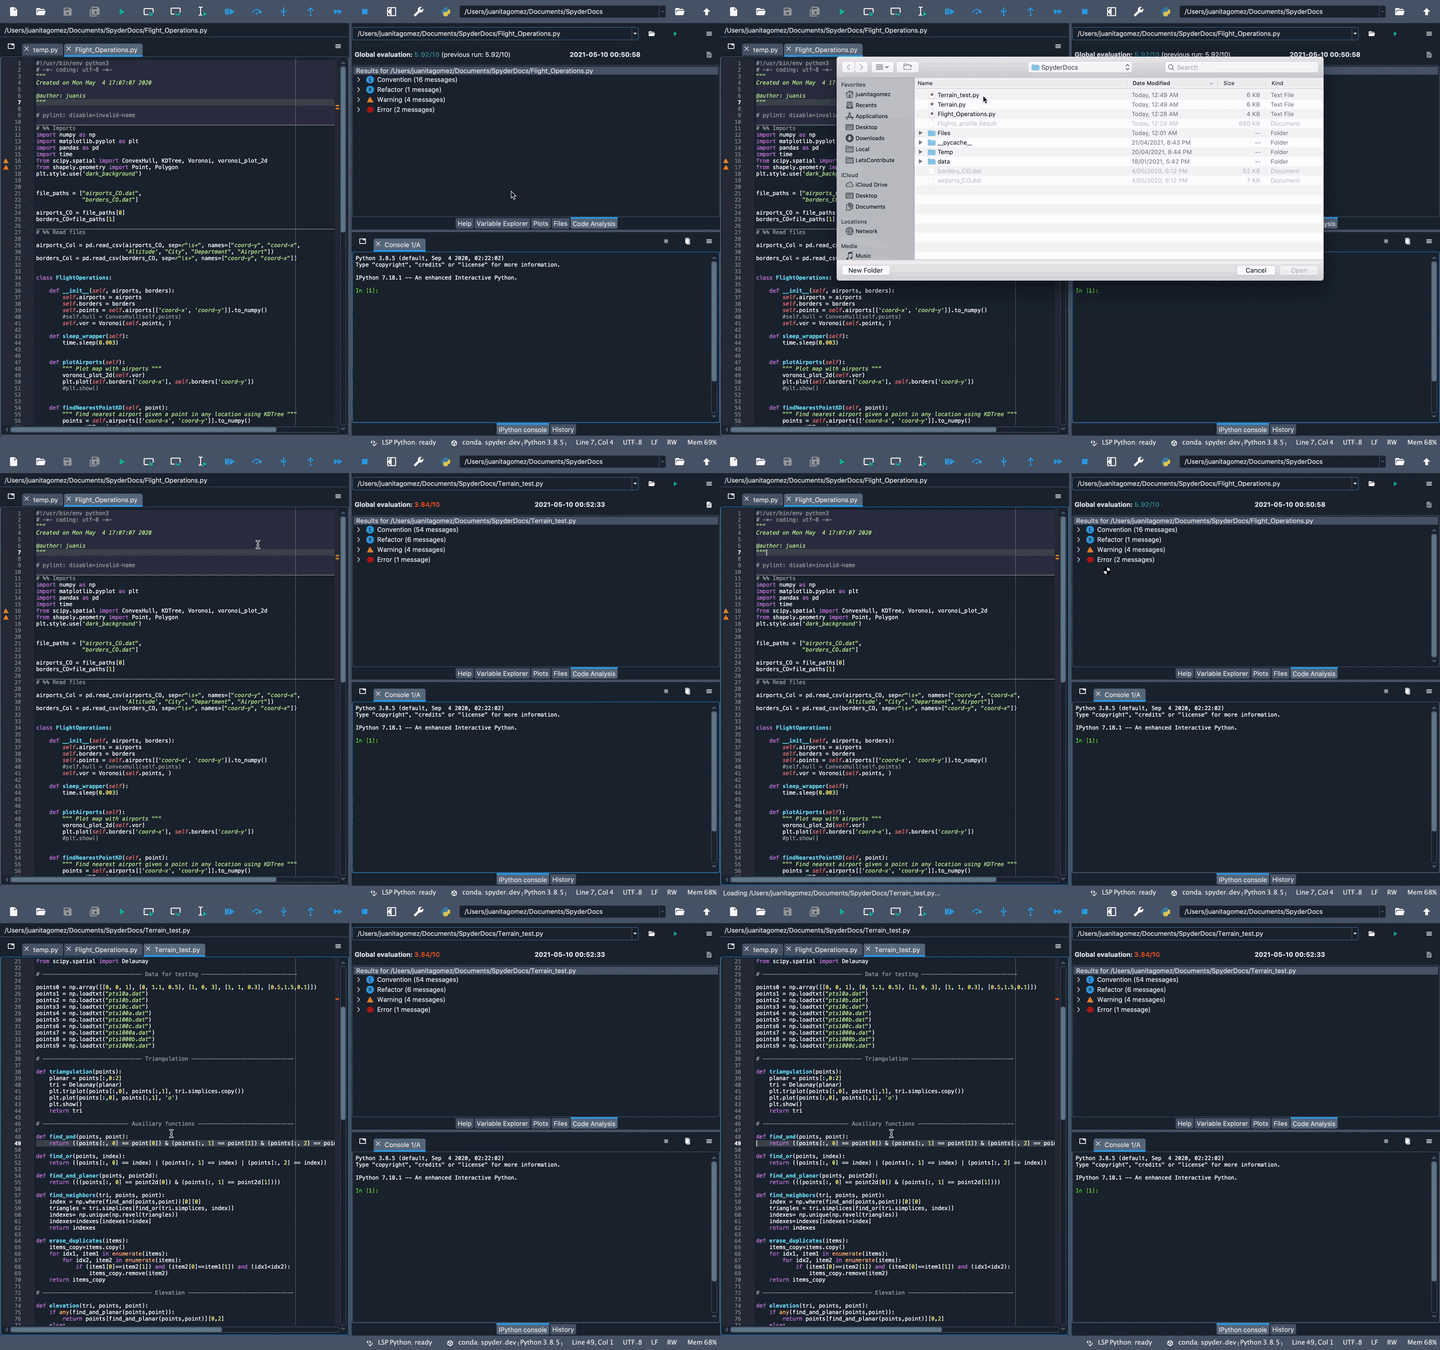
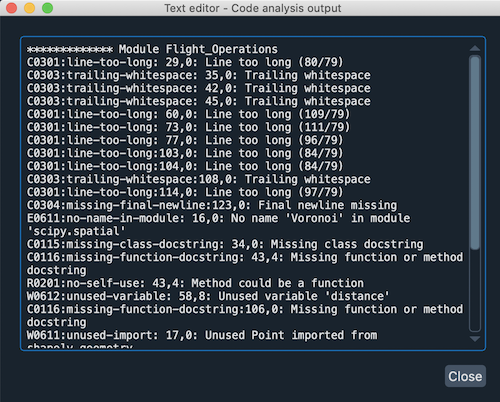
Cancel analyzing a file with the Stop button, and in case the analysis were to fail, click the Output button to find out why. Otherwise, assuming Pylint succeeds, the Output will show the raw plain text analysis results on the selected file, allowing you to easily browse and copy/paste the full message names and descriptions.
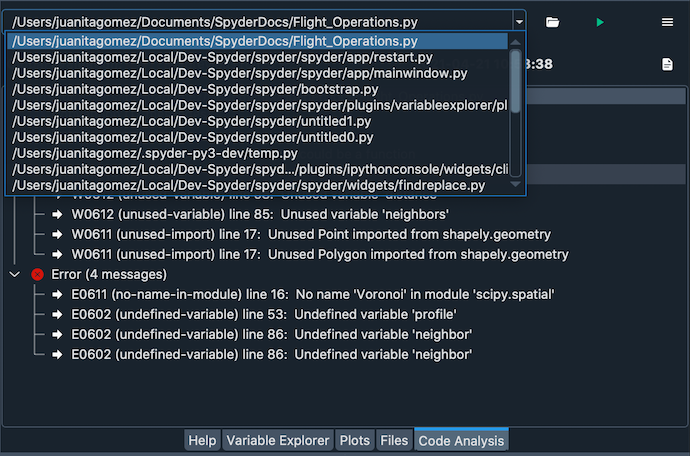
Finally, you can click the dropdown arrow in the filename field to view results of previous analyses.
Options menu#
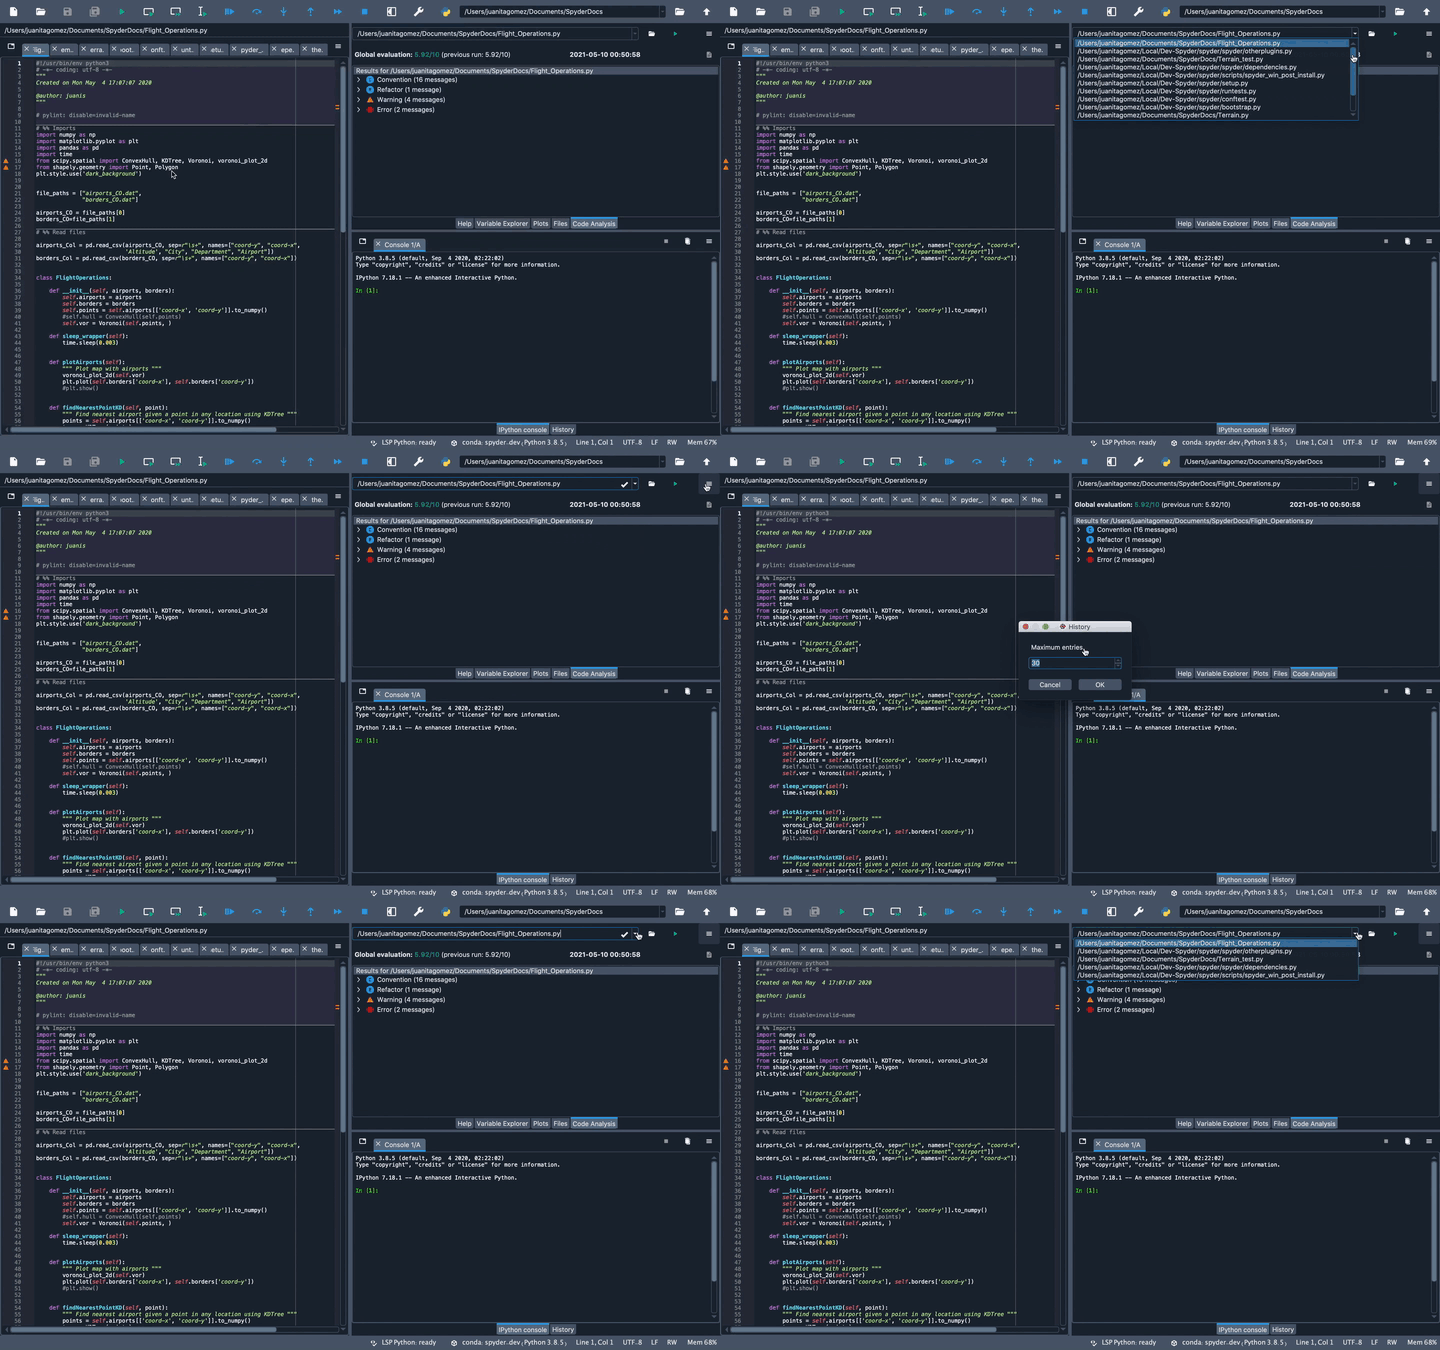
The number of recent runs Spyder should remember can be customized in the History… dialog, available from the Code Analysis options (hamburger) menu in the top right of the pane.
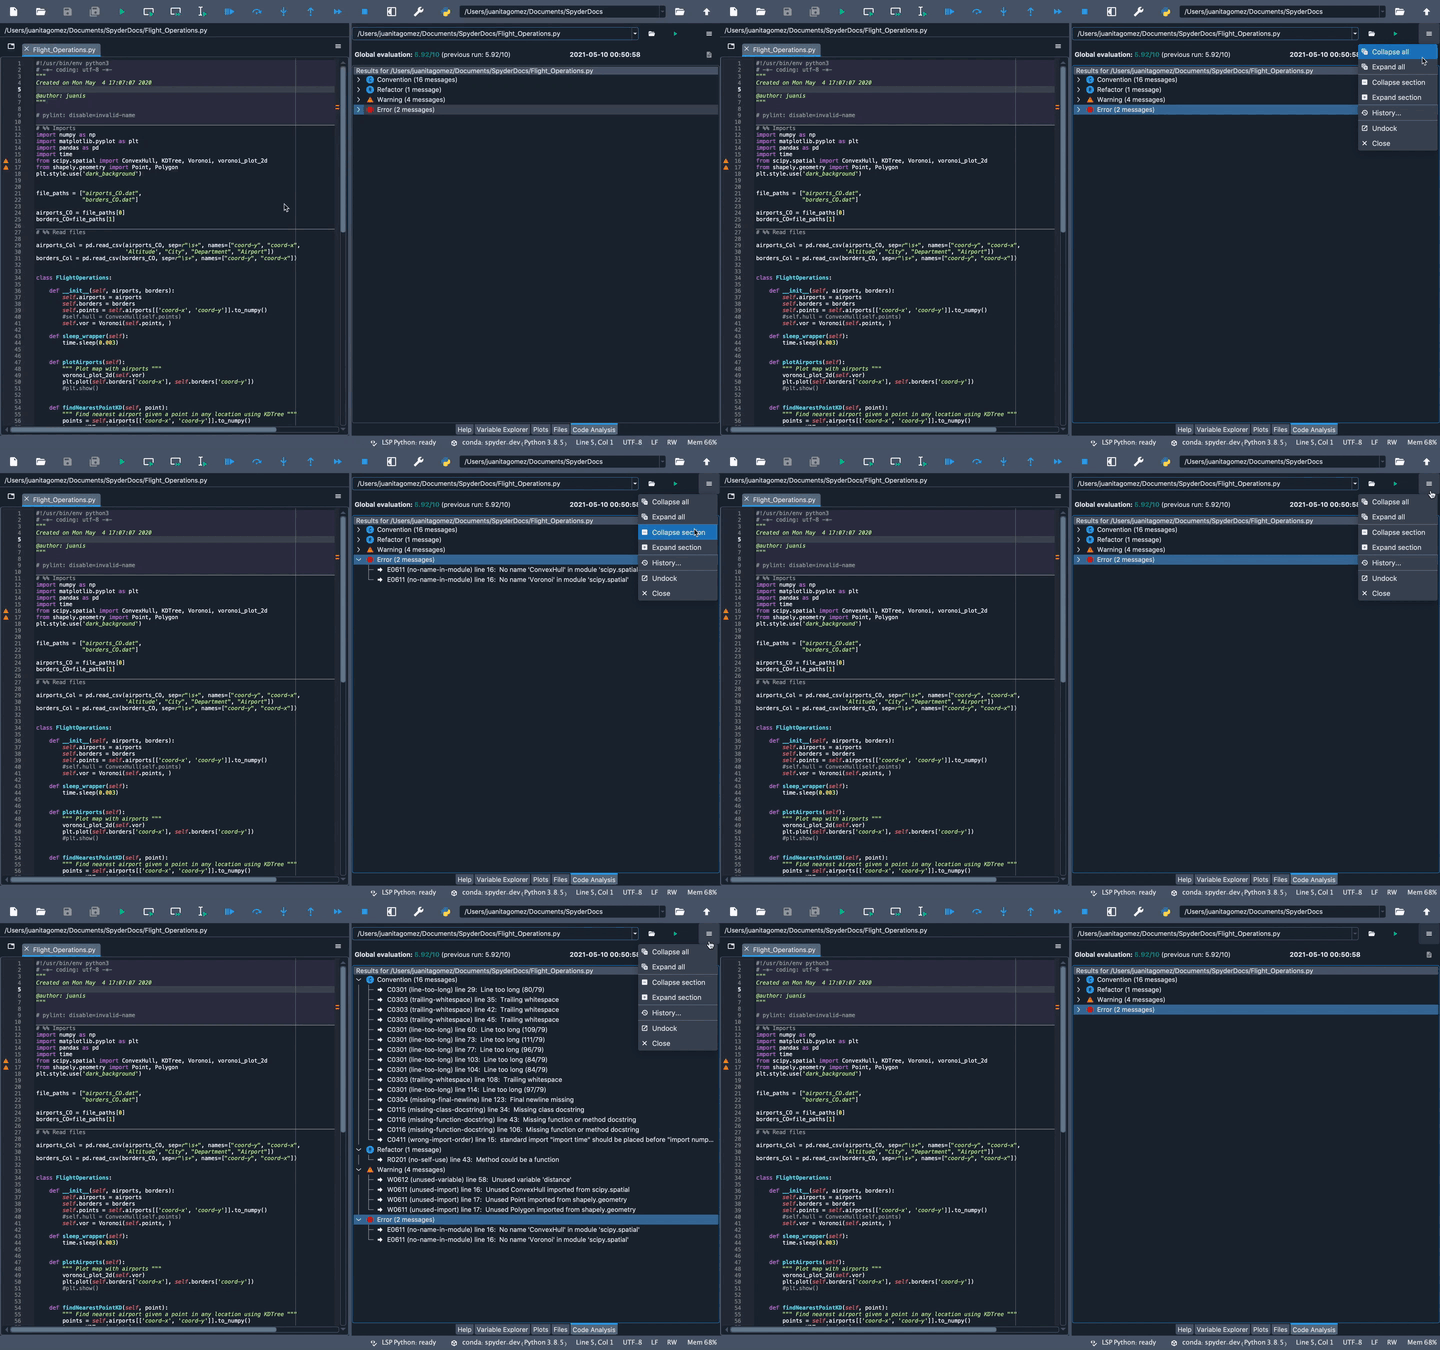
You can also expand or collapse one or all the sections in the pane by using the corresponding options in that menu.
Advanced options#
You can turn certain messages off at the line, block or file/module level by adding a # pylint: disable=MESSAGE-NAMES comment at the respective scope, where MESSAGE_NAMES should be replaced with a comma-separated list (or single value) of Pylint message names.
For example, a directive might look like # pylint: disable=invalid-name, or # pylint: disable=fixme, line-too-long.
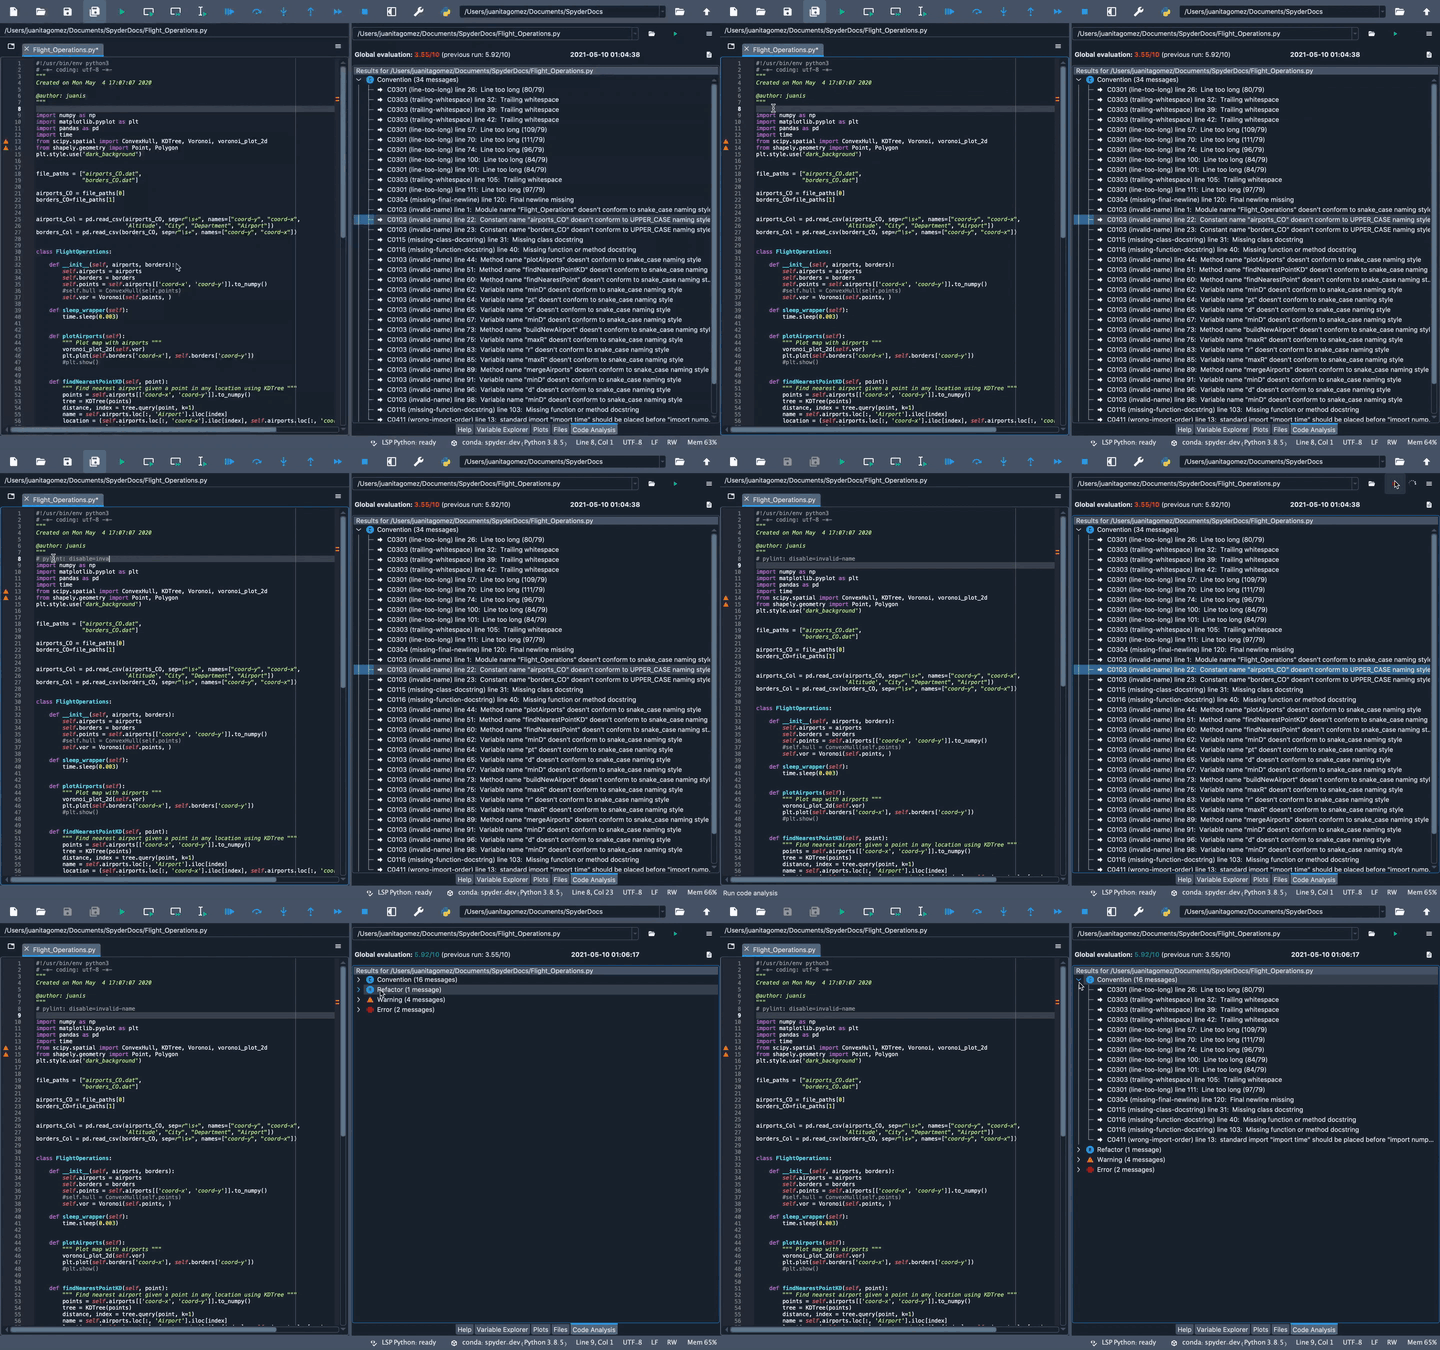
Or, you can globally suppress specific messages and adjust other Pylint settings by editing the .pylintrc configuration file in your user home folder.
If it doesn’t exist, you can generate it by running pylint --generate-rcfile > .pylintrc in your user home folder, from the Anaconda Prompt (on Windows) or your terminal (macOS/Linux).
For more details on configuring Pylint, see the Pylint configuration documentation.