
Debugger#
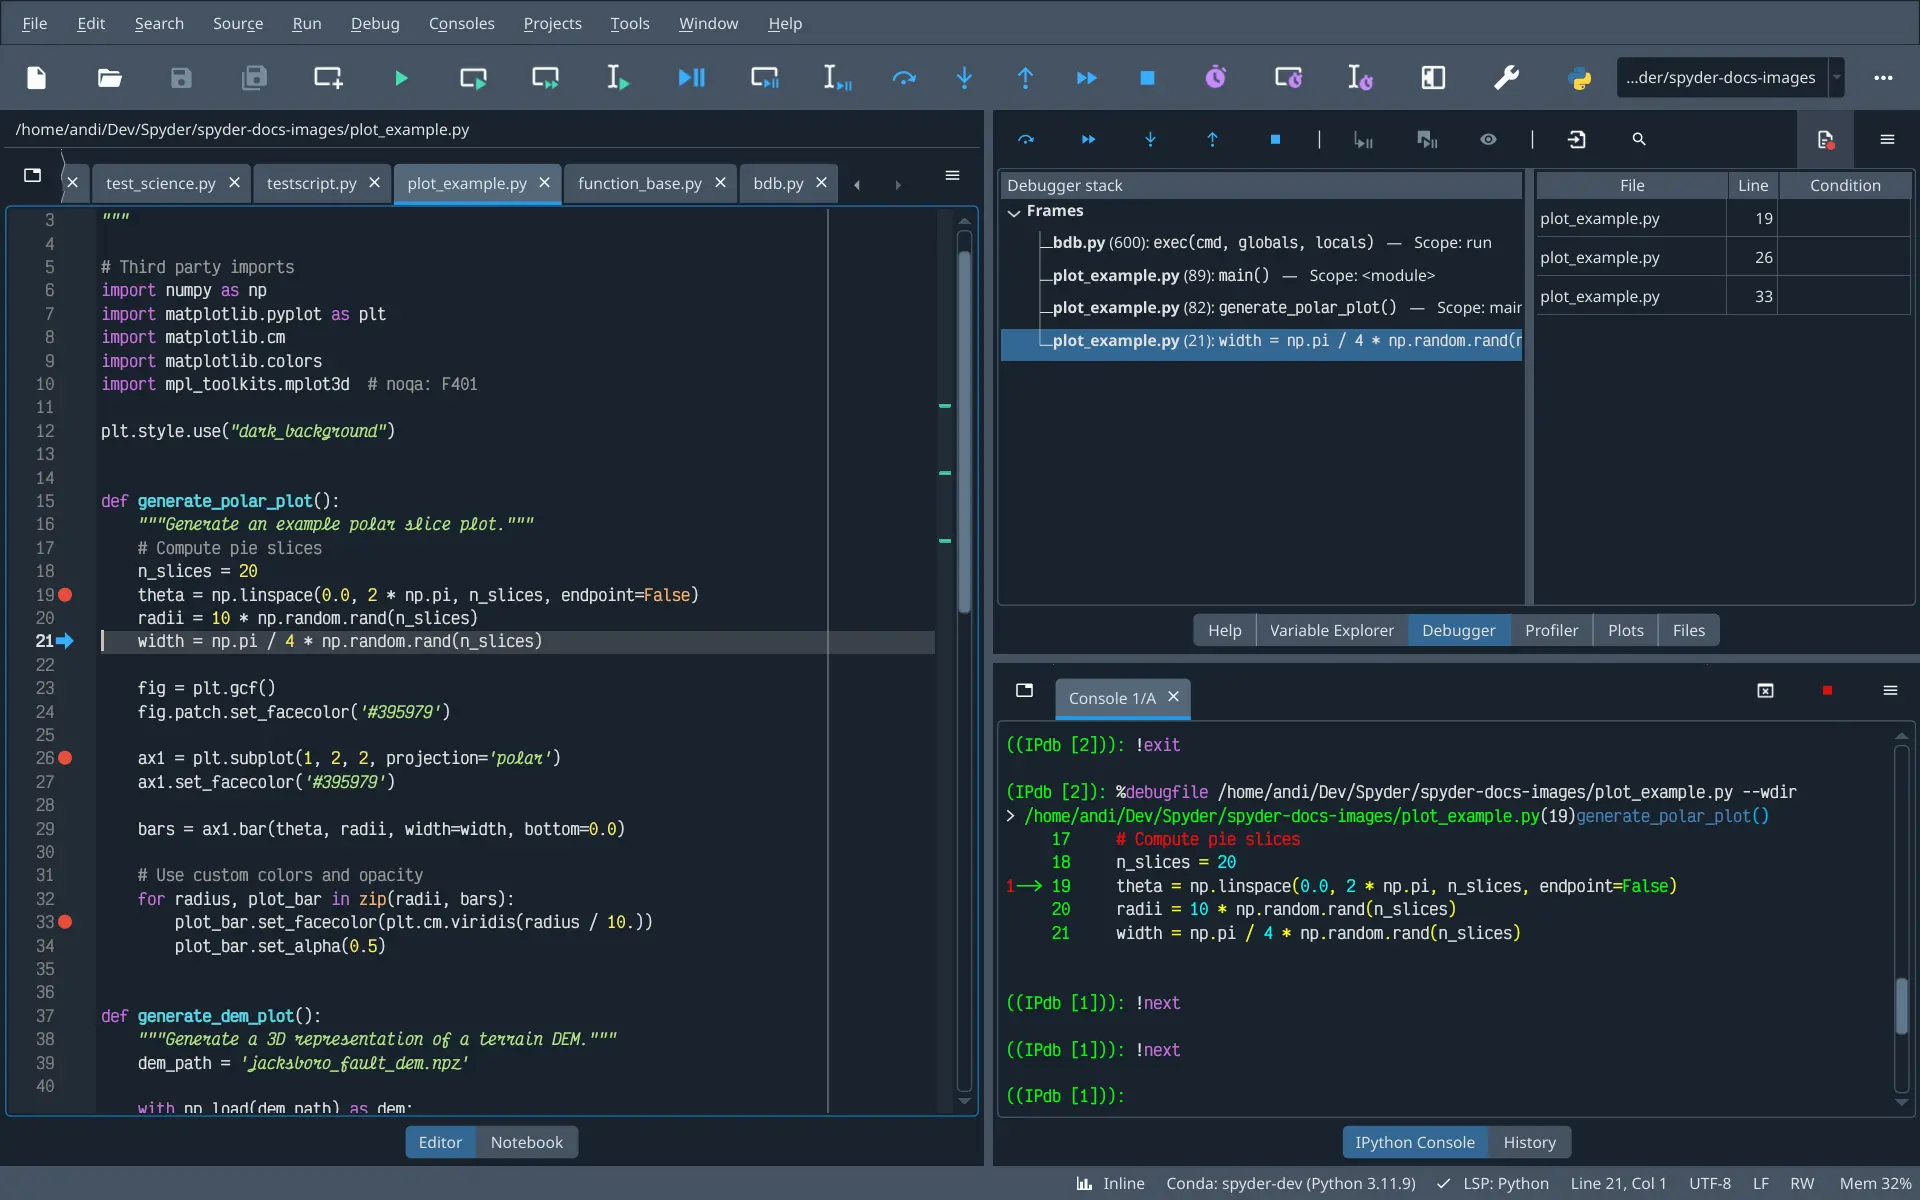
The new Debugger pane added in Spyder 6 allows you to control the debugging process, browse and navigate the current execution stack, and view and manage active breakpoints throughout your files. This uses the enhanced IPdb debugger, which can be controlled via the buttons in Spyder’s main toolbar and the IPython Console.
Debugging with Spyder#
You can control debugger execution via the buttons in the main toolbar and Debugger pane, as well as from the Debug menu and via configurable keyboard shortcuts, along with the standard ipdb console commands.
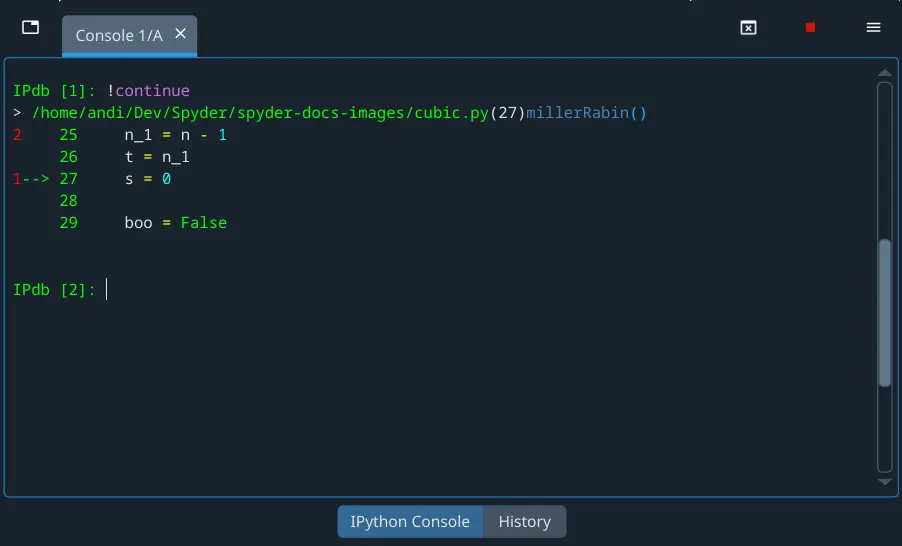
The Editor shows the line of code the debugger is currently stopped on with an arrow, as well as red togglable circles for breakpoints.

Spyder’s debugger offers syntax highlighting, code completion and command history, which work just like they do in the normal interactive interpreter. Use the up and down arrows to recall previous commands, and press Tab to trigger autocomplete suggestions.
Furthermore, IPython’s magic functions are available in debugging mode.
You can, for example, run %ls to list the contents of your current working directory or %timeit to check how fast a given snippet of code is.
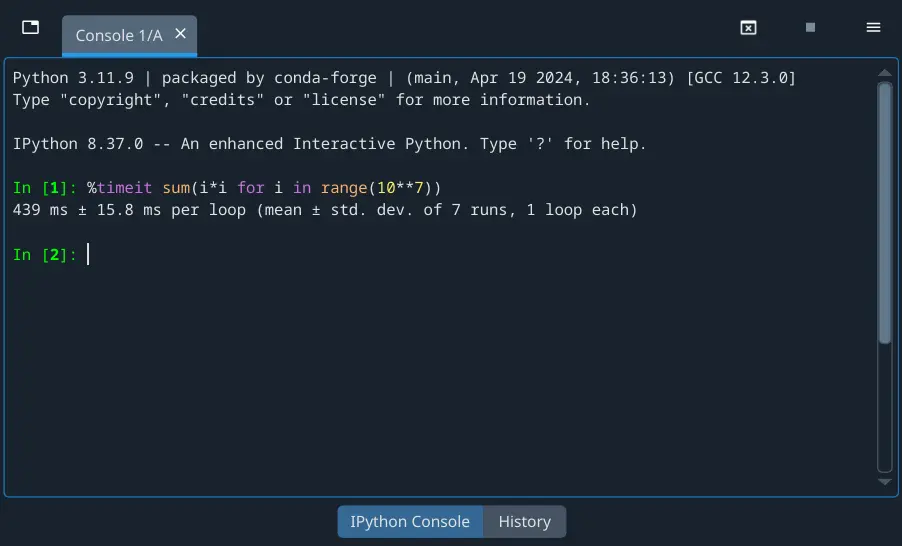
Finally, you can enter and execute multiline statements in Spyder’s debugger just like with the regular IPython prompt, to easily run complex code.
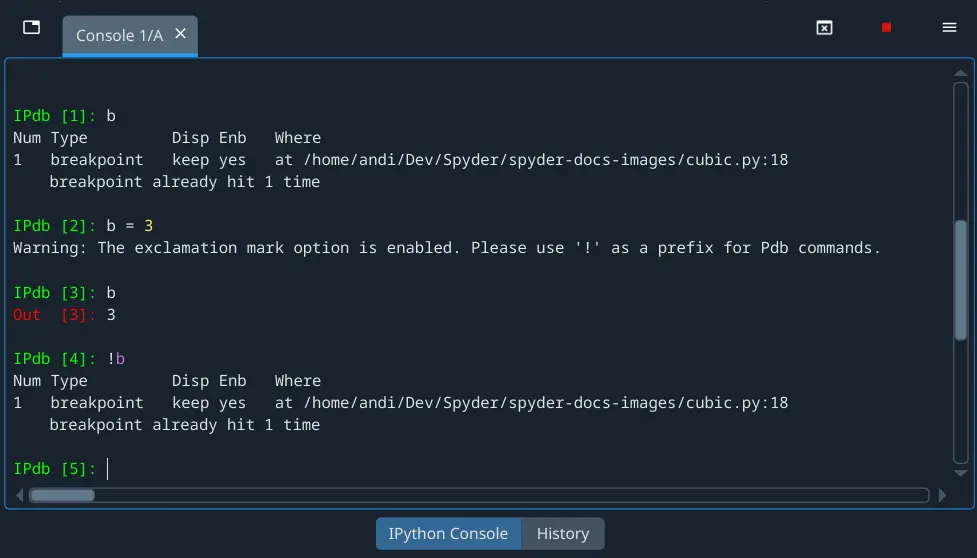
If your code has variables with the same names as IPdb commands (e.g. b or step), you can still refer to those variables as normal while debugging.
To call the respective IPdb command, add an exclamation point before it (e.g. !b or !step).
Breakpoints#
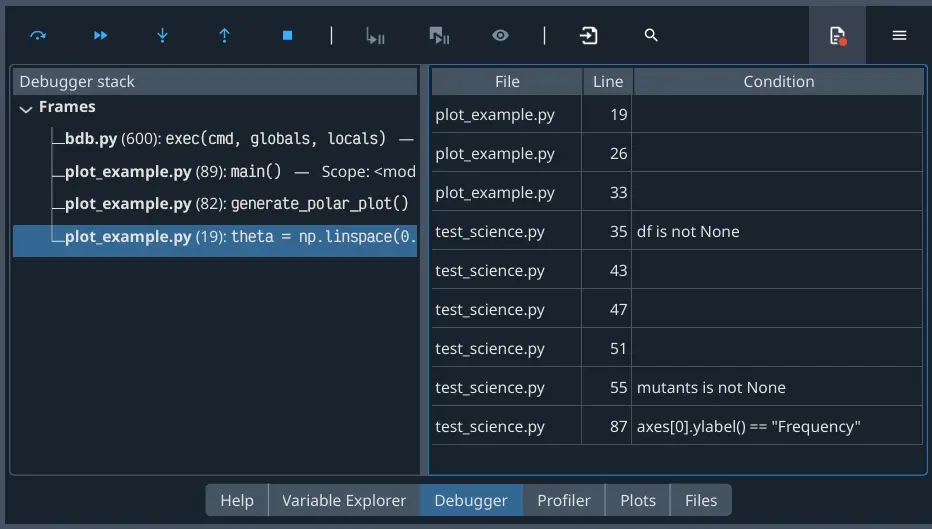
The right section of Spyder’s Debugger pane lists the file, line, and condition (if any) of every breakpoint defined in any open file. To open it, select , or press the file icon to the right of the Debugger pane toolbar.
There are several different ways to set and clear breakpoints:
With the Toggle breakpoint item in the Debug menu (Set/edit conditional breakpoint to edit the condition of a breakpoint).
Through pressing the configurable keyboard shortcut (by default, F12 to toggle a breakpoint, and Shift-F12 to set a condition).
By clicking to the left of the line number in an open file in the Editor (holding Shift for a conditional breakpoint).
With the
breakpoint()builtin function in your code.Interactively, using the
bcommand in a debugging session.
You can access and edit local and global variables at each breakpoint through the Variable Explorer.
Stack frame browser#
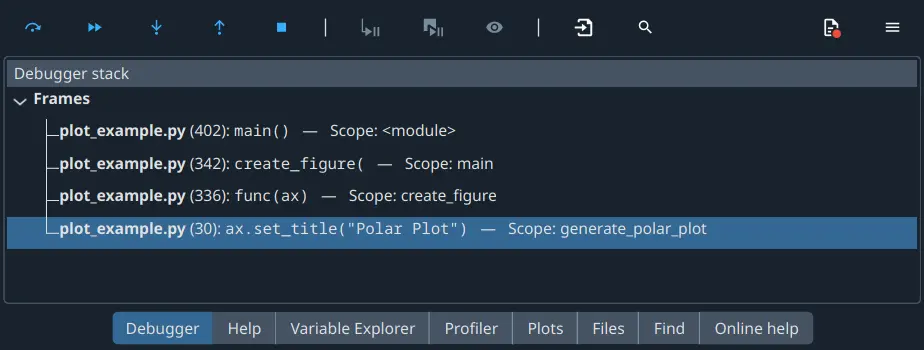
New in Spyder 6, the Debugger pane now features a stack frame browser, allowing you to easily view and explore the execution stack while debugging.
Note
Each time your code calls a function, it is added to the stack and execution continues inside that function, with further levels being added if that function itself calls further functions. When a function finishes executing and returns, it is popped from the stack and execution continues with the function that called it, on the previous level of the stack. Each level of the stack has its own namespace, i.e. its own local variables, and normally cannot directly access those defined within other levels, so that variables in different functions don’t conflict. You can think of it like a “stack” of papers, which each paper being a function that forms one level of execution, the values of local variables being written only on that one sheet of paper and papers being added or removed only from the top of the stack.
The highest-level code where execution started is shown at the top, while the lowest-level function, the one currently executing, is shown at the bottom, just like in an error traceback. From left to right, you can see the filename, line number in the file and the line of code that was last executed at that level. Clicking any line will jump to that level in the execution stack, allowing you to run code in that context in the IPython Console. Furthermore, it will also display that file in the Editor, with the arrow icon pointing to the line that was run there, and the Variable Explorer will switch to show the values of the local variables visible in that stack frame’s namespace.
The stack frame browser also allows you to explore the levels of an error traceback after an exception occurs, as well as inspect the execution stack of code currently running in the IPython Console, without having to start a debugging session. When clicking the Inspect execution toolbar button or an exception is raised, the relevant stack frames are displayed in the browser, in the same format as when debugging, and you can click each level of the traceback to jump to that file and line.
Advanced features#
If your code is taking a long time to run, or you want to see what it is doing at any given point, you can use the Inspect execution button in the Debugger pane toolbar. This retrieves the current stack frame from the kernel and displays it in the Stack frame browser, without interrupting execution or launching a new debugging session.
To actually stop executing your code and launch the debugger inside the current execution, use the Interrupt execution and start the debugger button in the pane’s toolbar. This starts a live debugging session, in which you can run code and inspect variables to try to understand why the execution is taking too long to finish.
The Debugger pane also automatically displays the full traceback of the last exception raised by your code in the Stack frame browser, which it remembers even if you run something else or make changes to your files, until you either start a debugging session or another exception occurs. To jump into the debugger at the point the error occurred, press the Start debugging after last error button in the Debugger pane toolbar.
Debugger options#
You can avoid stepping through other Python packages while debugging by enabling the Ignore Python libraries while debugging option in Spyder’s Preferences, under . This will skip stopping on any line of code inside the built-in and third-party Python modules you have installed, to focus on debugging your own code.
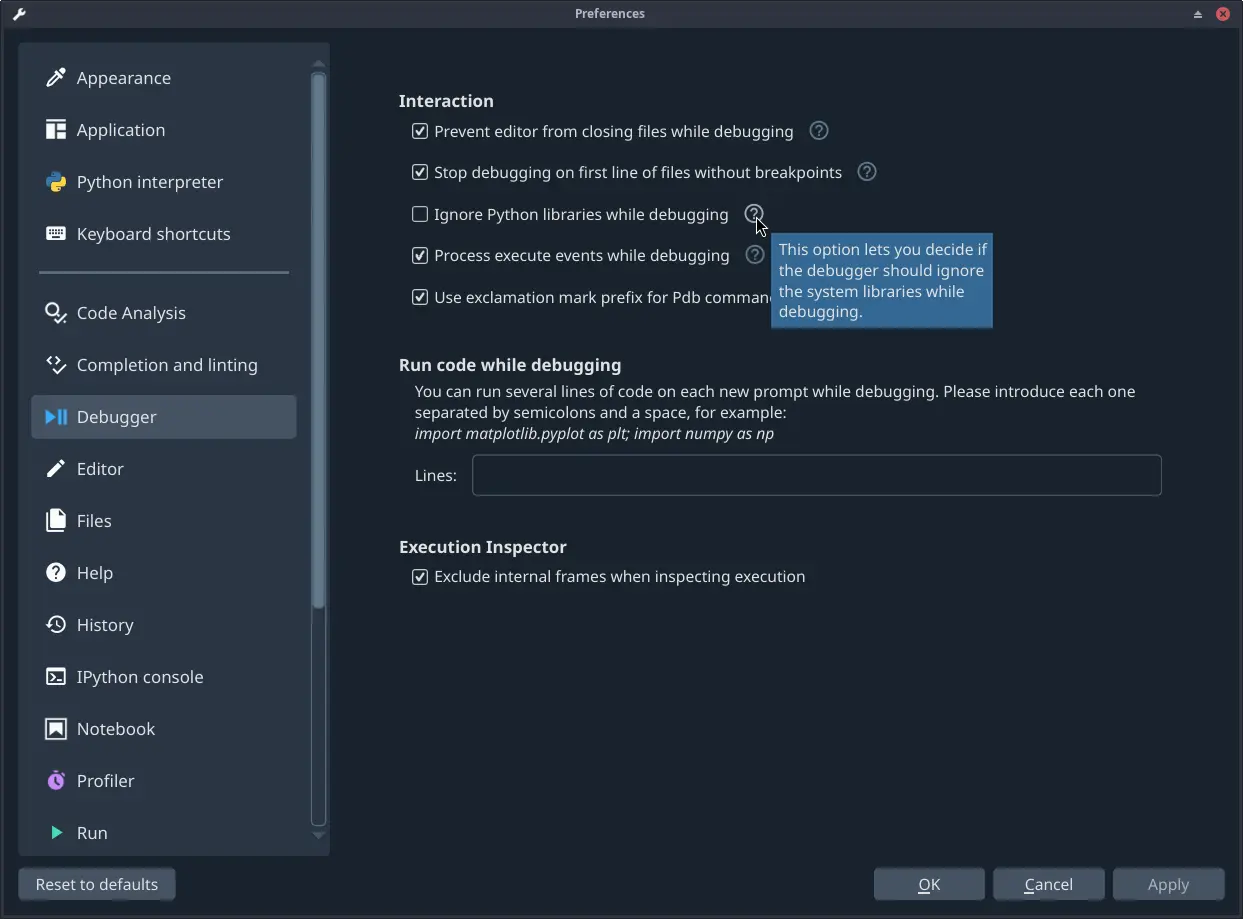
You can have Spyder automatically execute a custom snippet of code every time the debugger stops. For example, you can use this to set specific variables, or import commonly-used modules so they are always available while debugging. To set this up, go to , and enter the code that you want to be executed with each step.
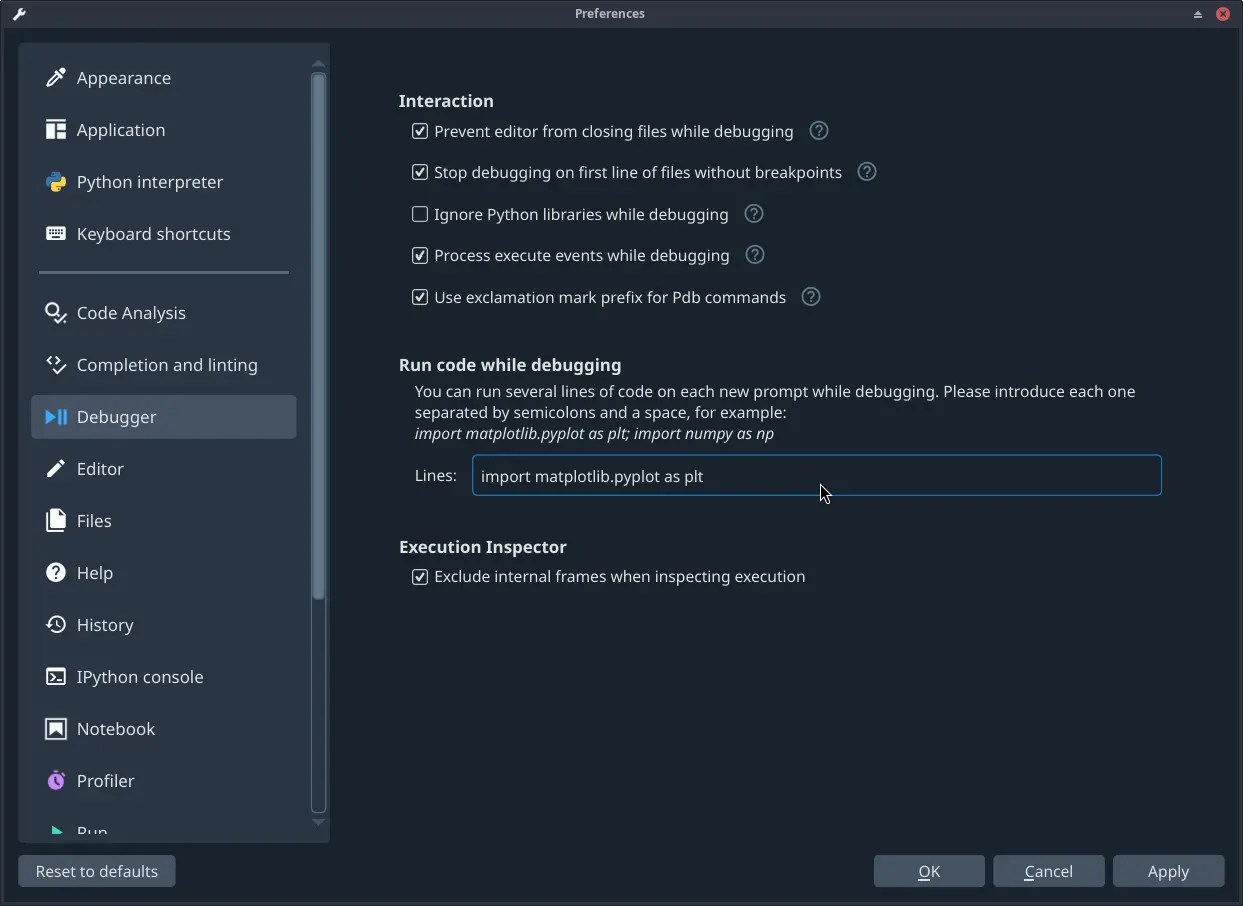
Generating Matplotlib figures is fully supported while the debugger is active, including all the different graphics backends described in the Plots.
To avoid showing plots while debugging, deactivate the Process execute events while debugging option in .