
Plots#
The Plots pane shows the static figures and images created during your session. It will show you plots from the IPython Console, produced by your code in the Editor or generated by the Variable Explorer, and allows you to interact with them in several ways.
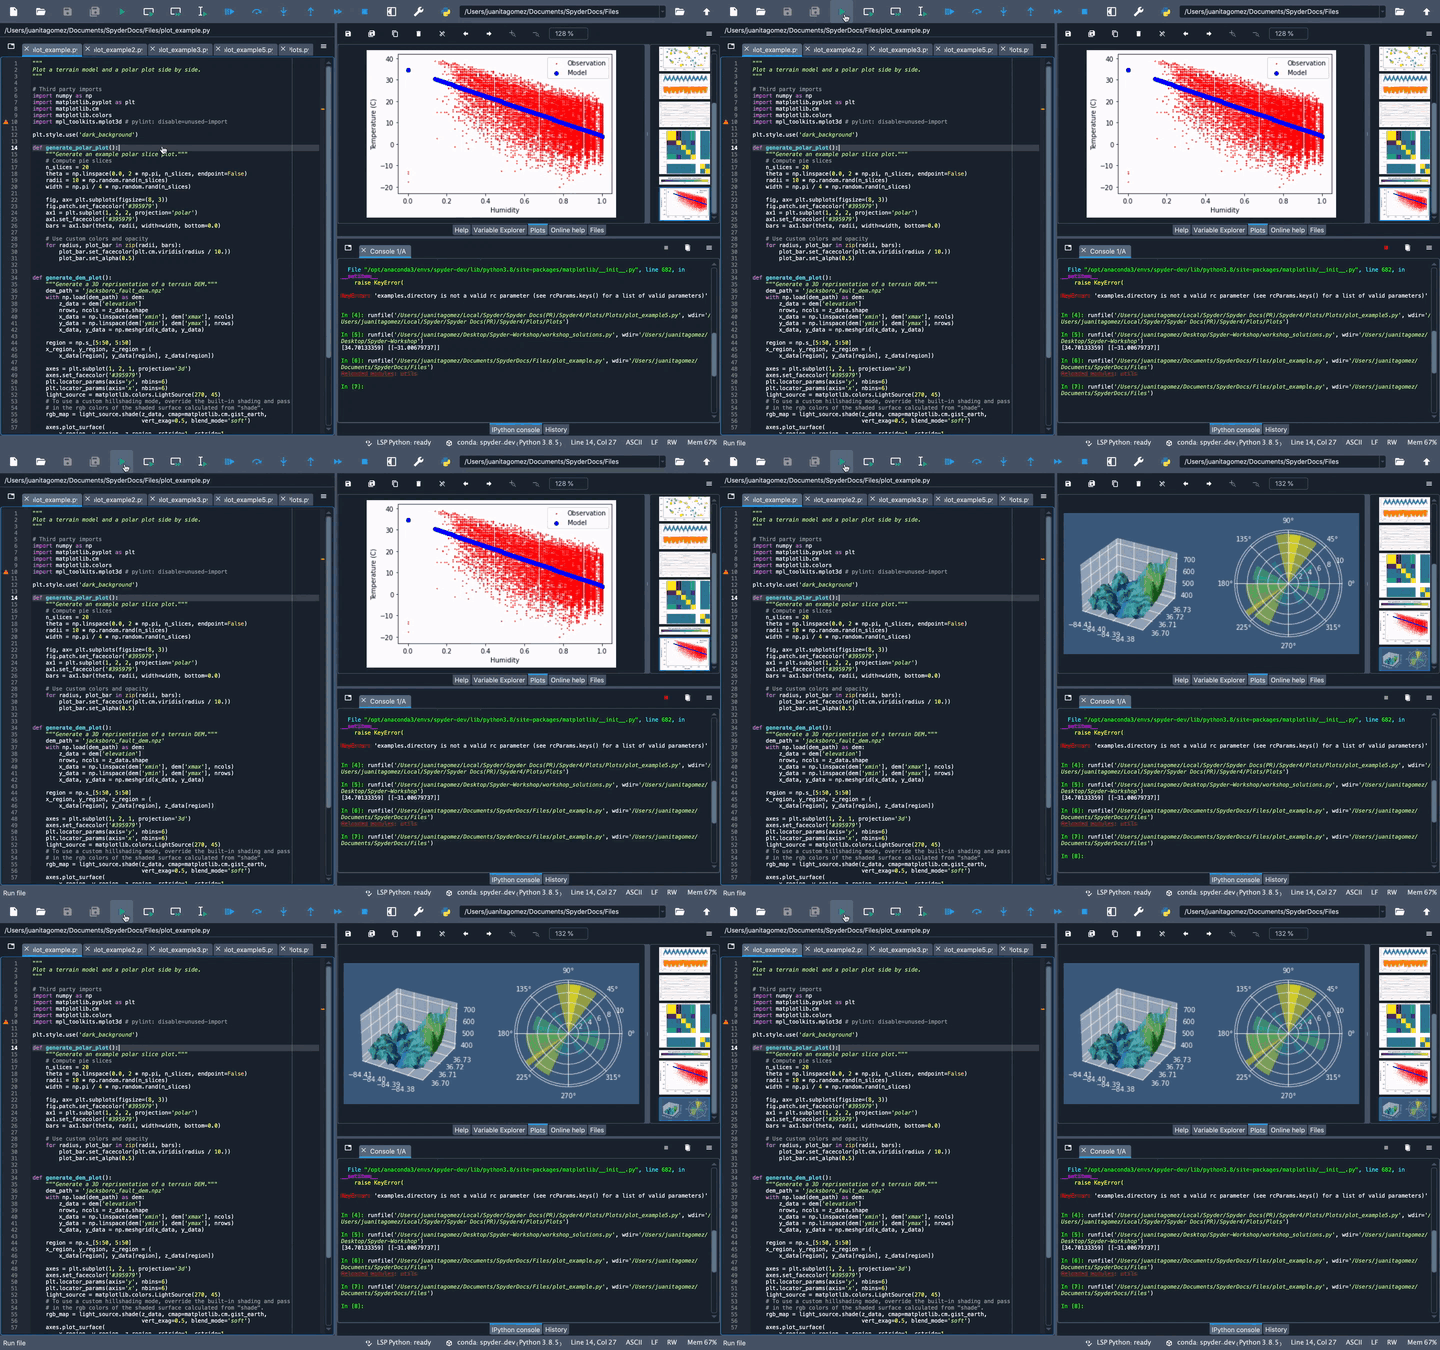
The figures shown in the Plots pane are those associated with the currently active Console tab; if you switch consoles, the list of plots displayed (or none at all, if a new console) will change accordingly.
Toolbar options#
The toolbar at the top of the Plots pane provides a number of useful features that allow you to interact with your figures.
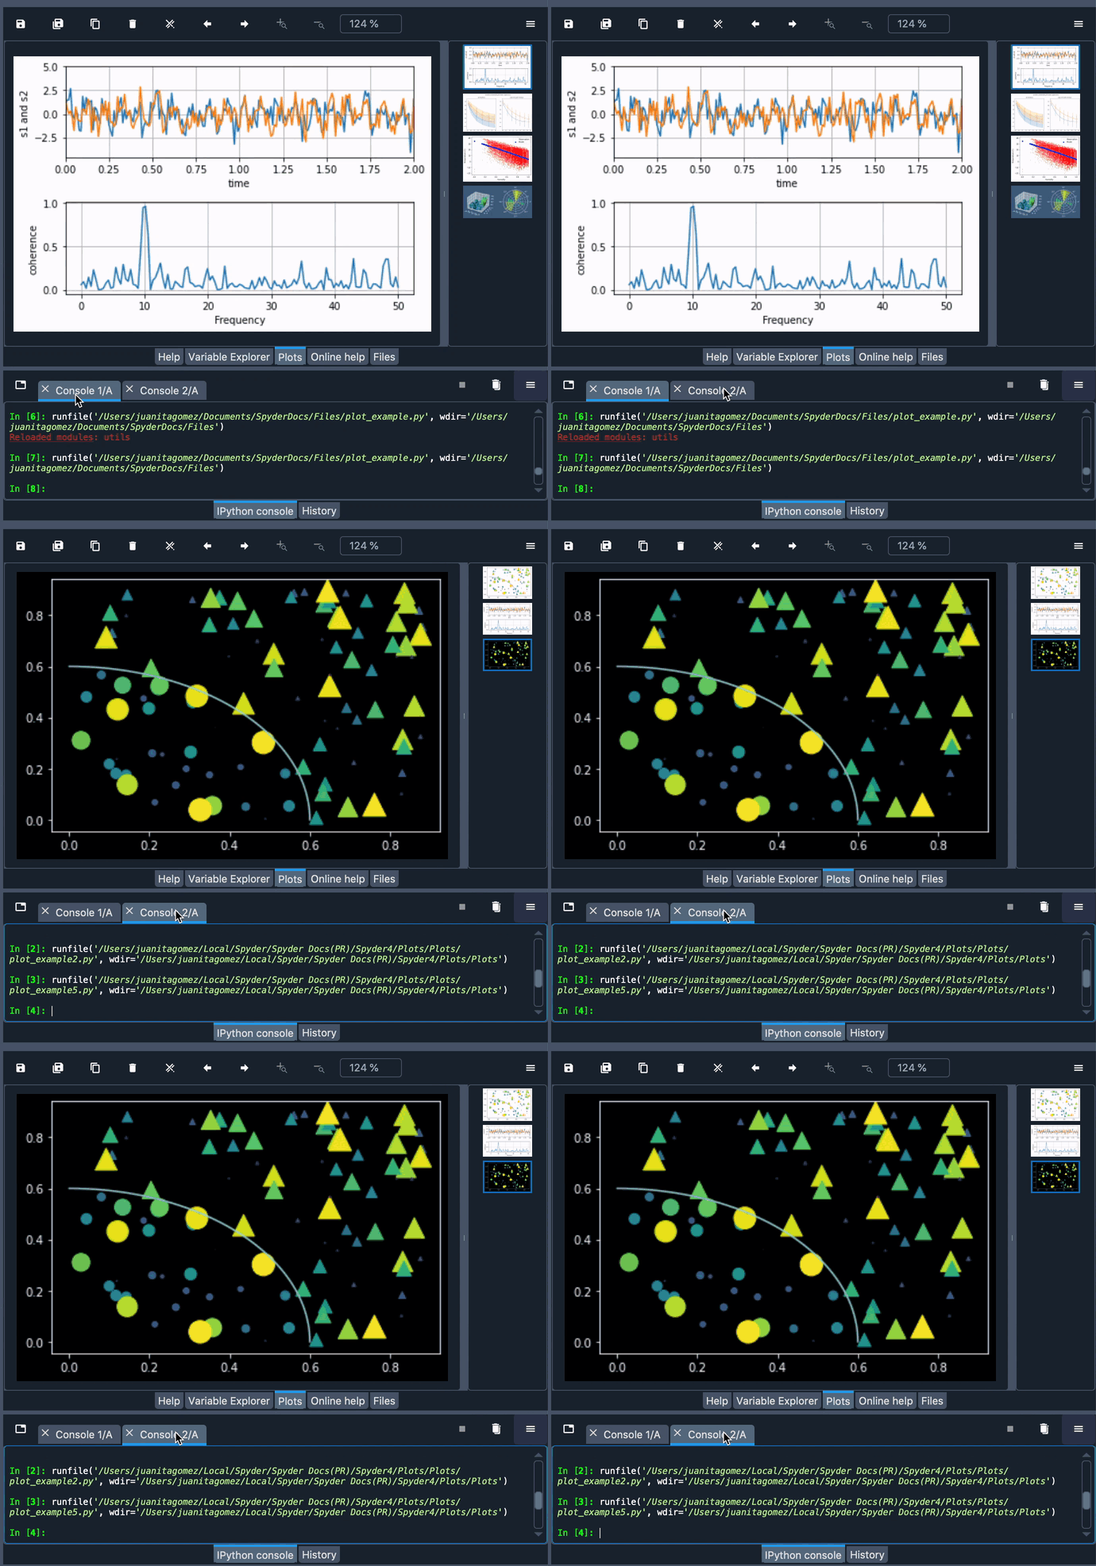
For example, you can cycle sequentially through the plot list with the forward and back arrows.
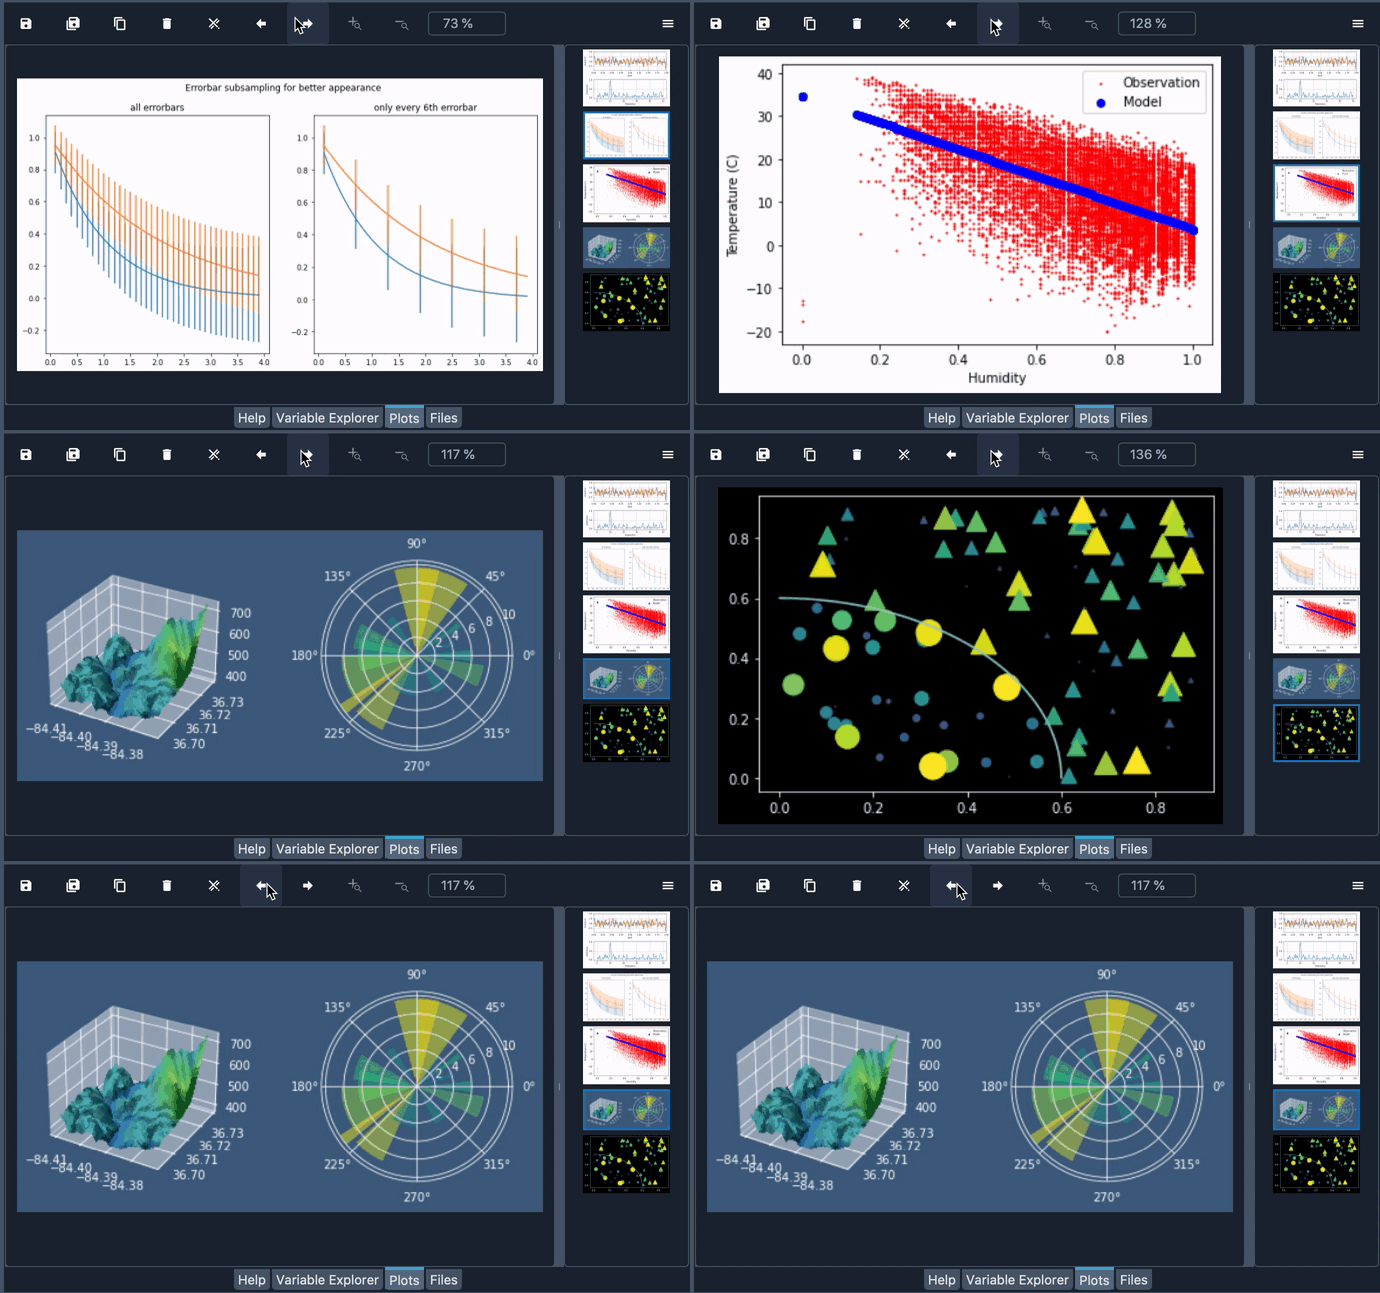
The -, + and Fit plot to pane size buttons and the associated percentage field allows you to control zoom level.
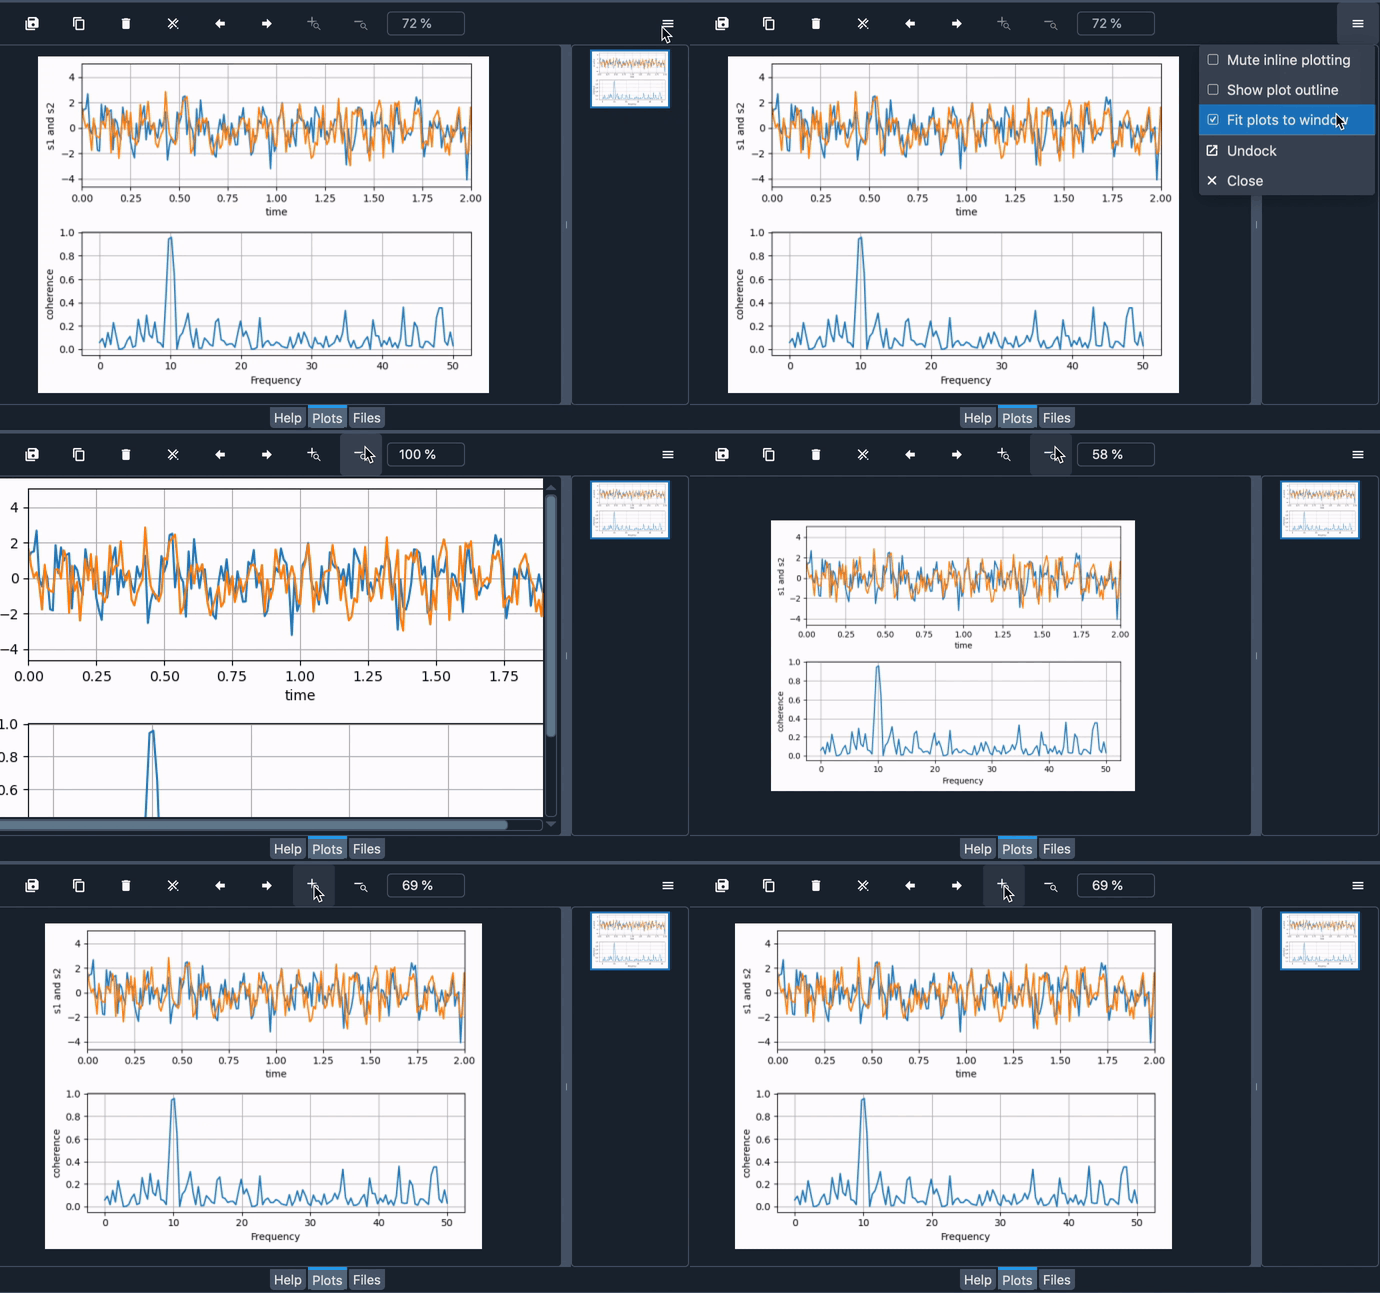
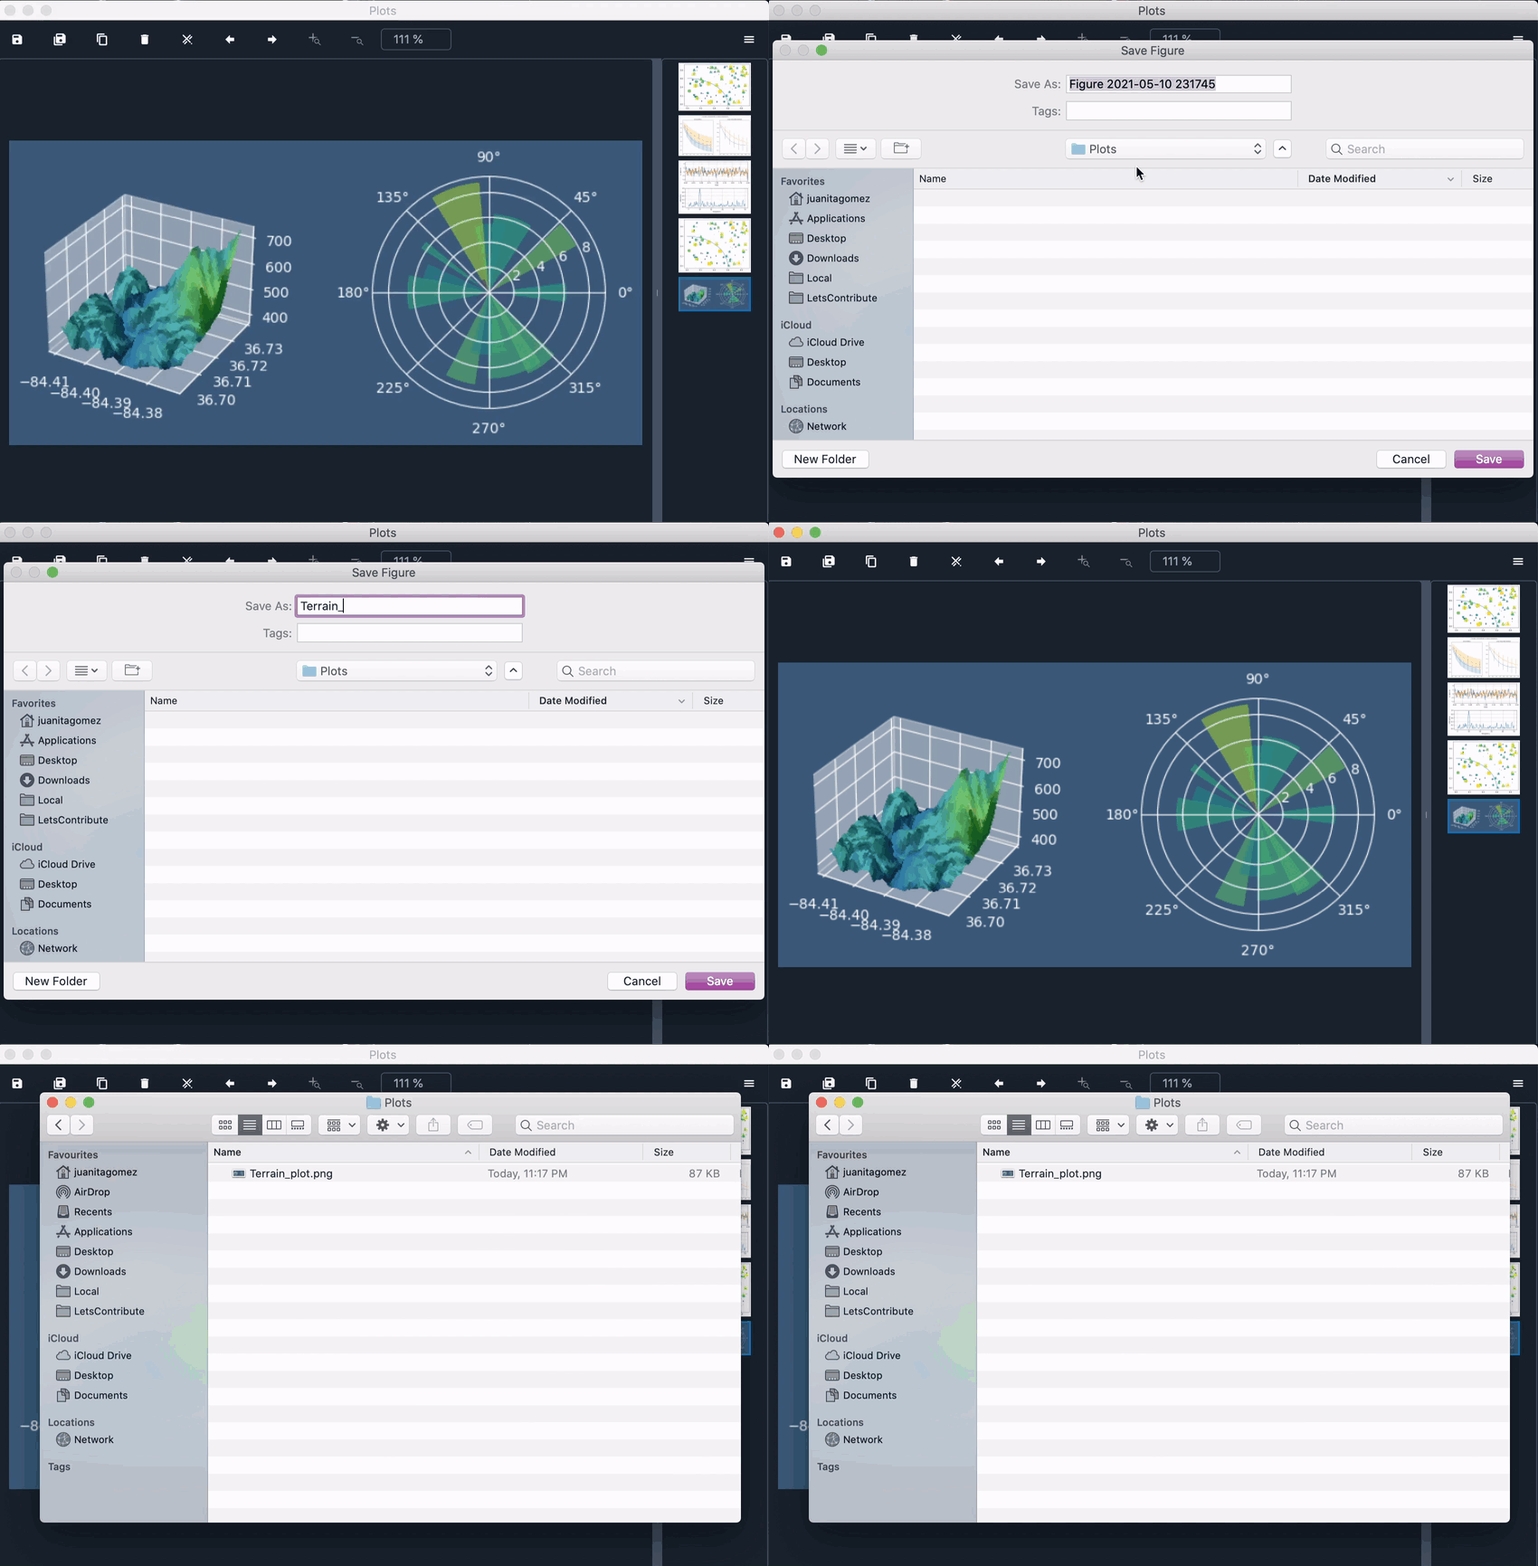
You can save one or all the plots in the pane to image file(s) by clicking the respective Save plot as and Save all plots buttons in the toolbar. Plots are rendered and saved as PNG (raster) by default, but SVG (vector) can be selected as an option under .
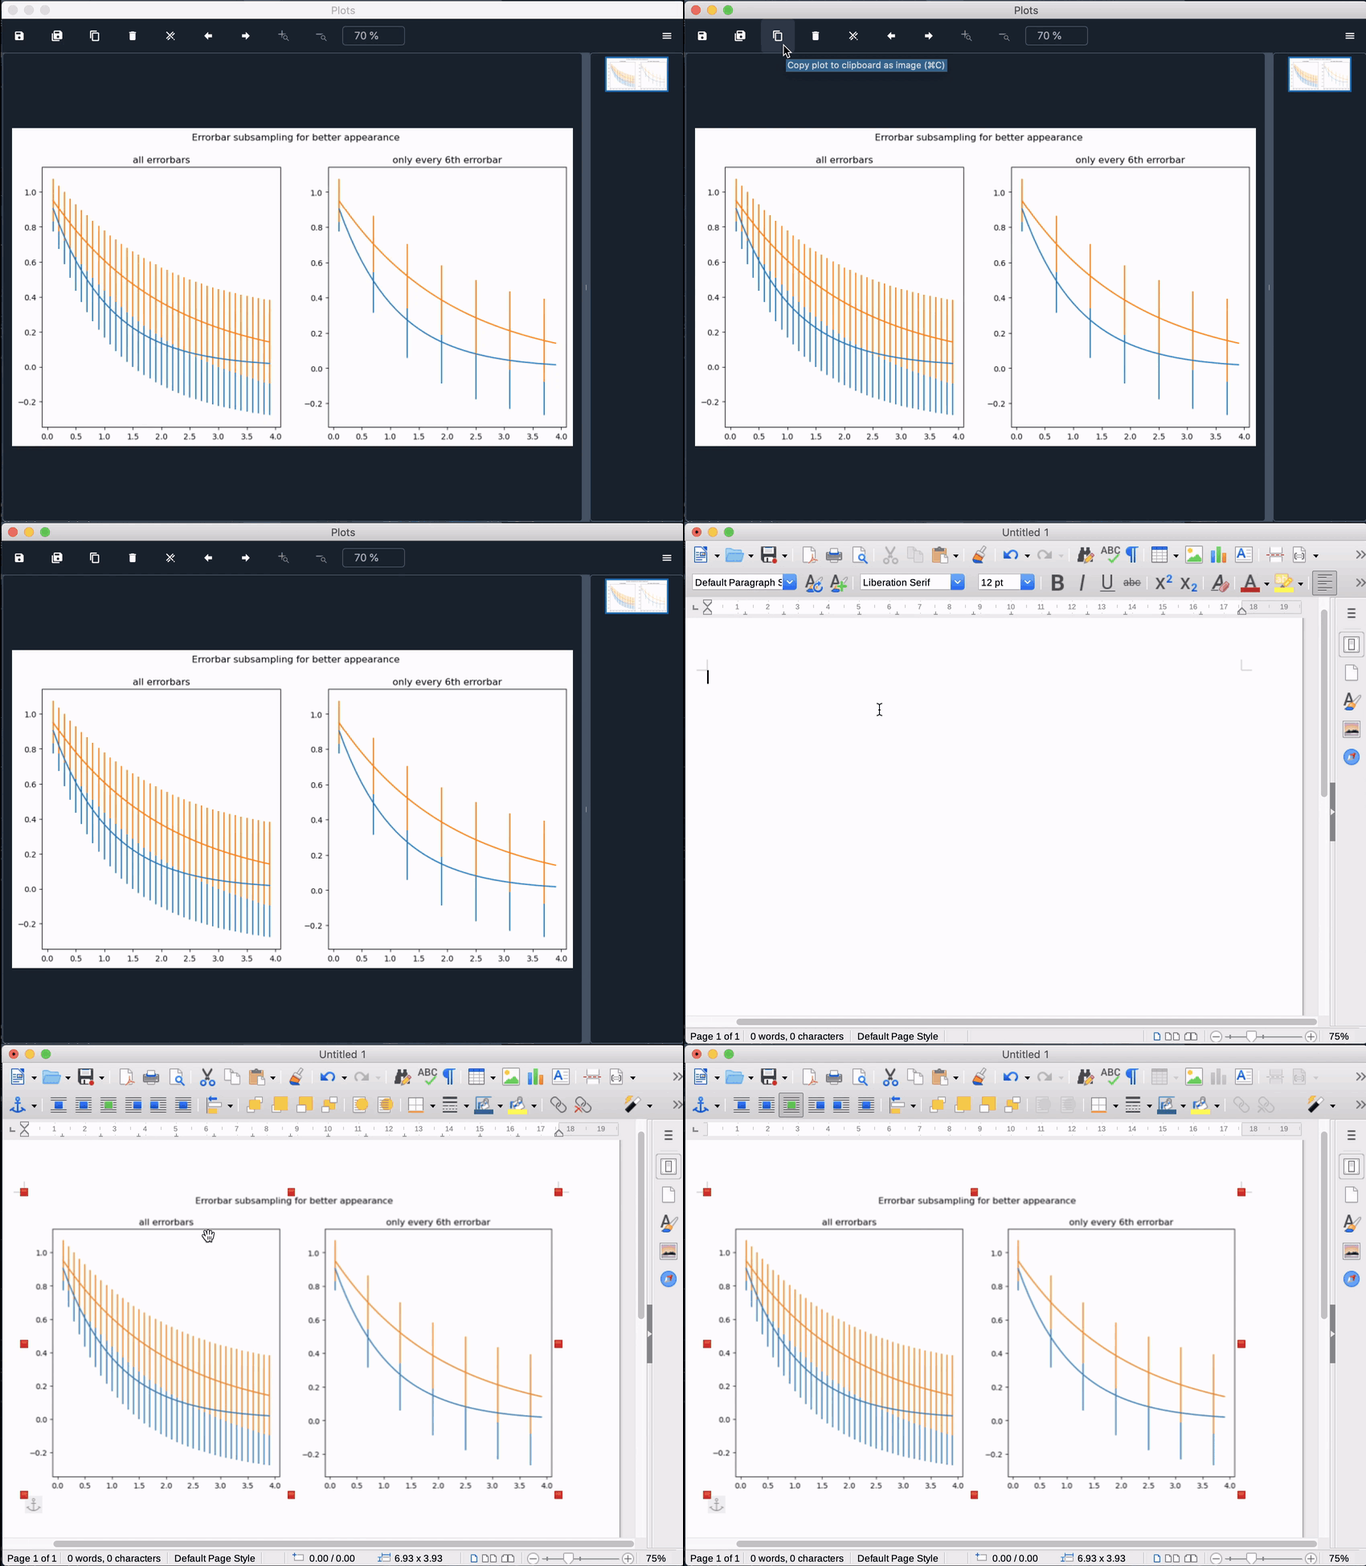
Additionally, if you want to use a figure in another document, you can click the Copy plot to clipboard as image button and paste your plot wherever you want, such as a word processor.
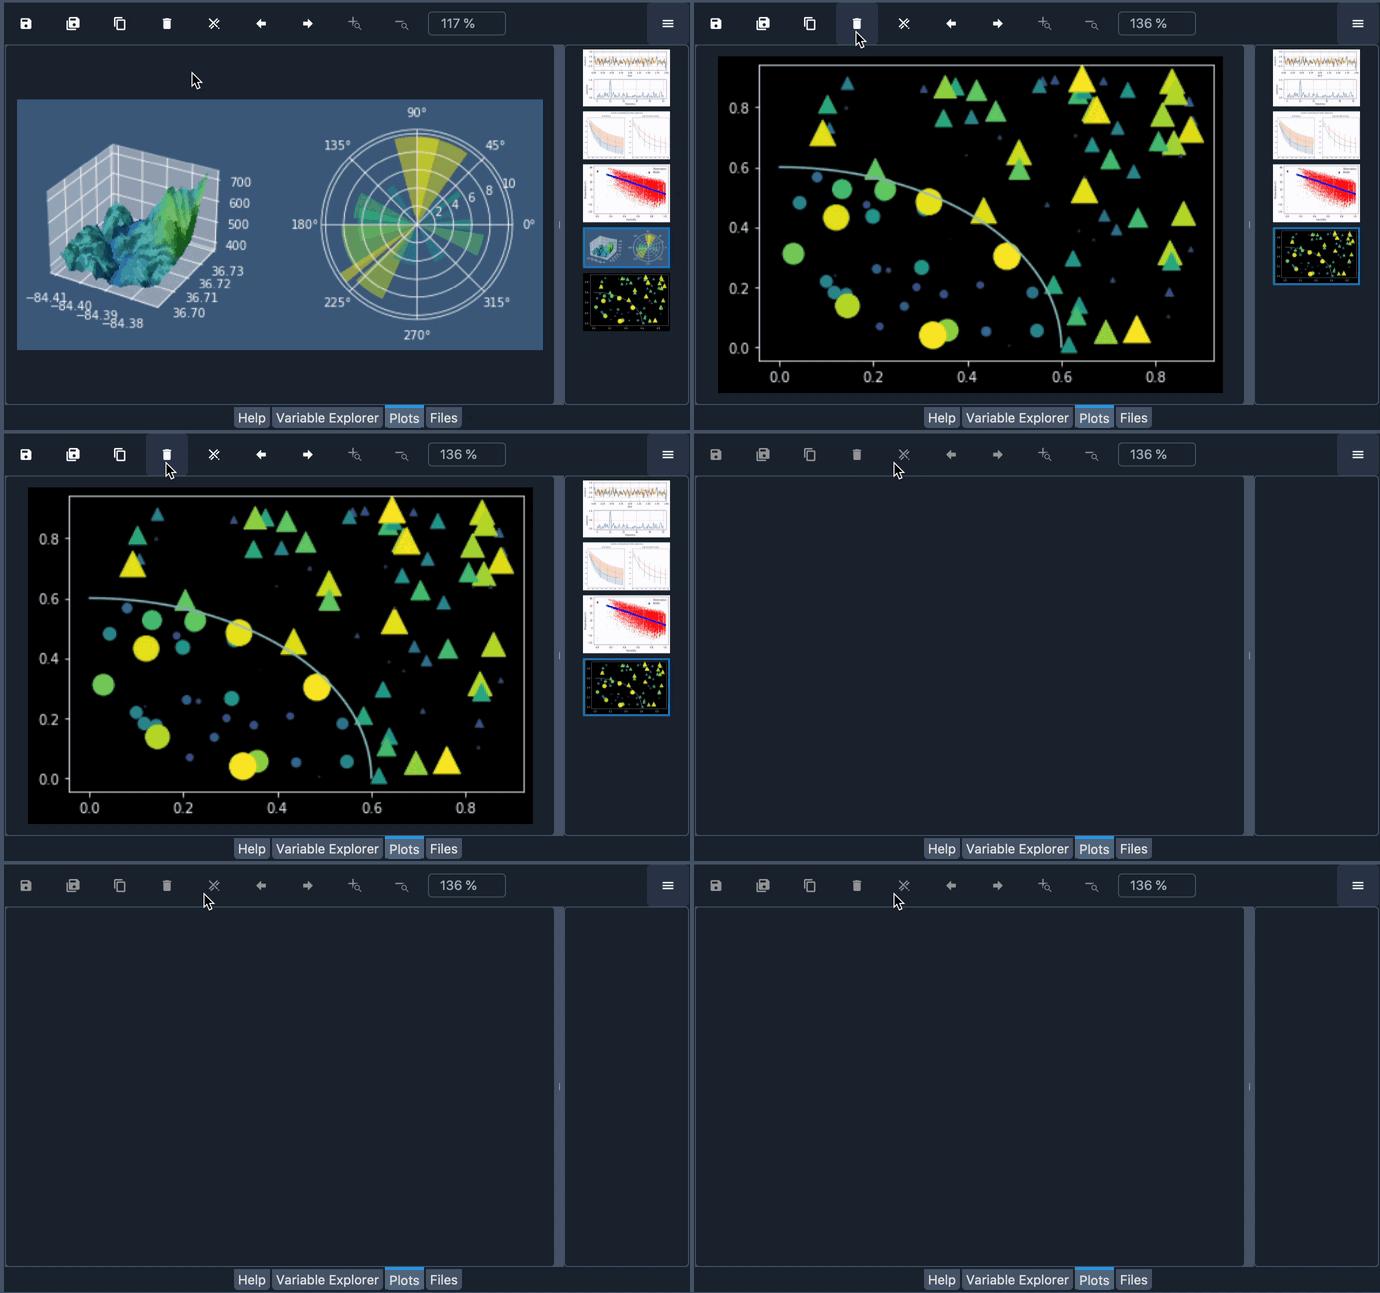
Finally, you can use the Remove plot and Remove all plots buttons in the toolbar to clear figures from the list.
Options menu#
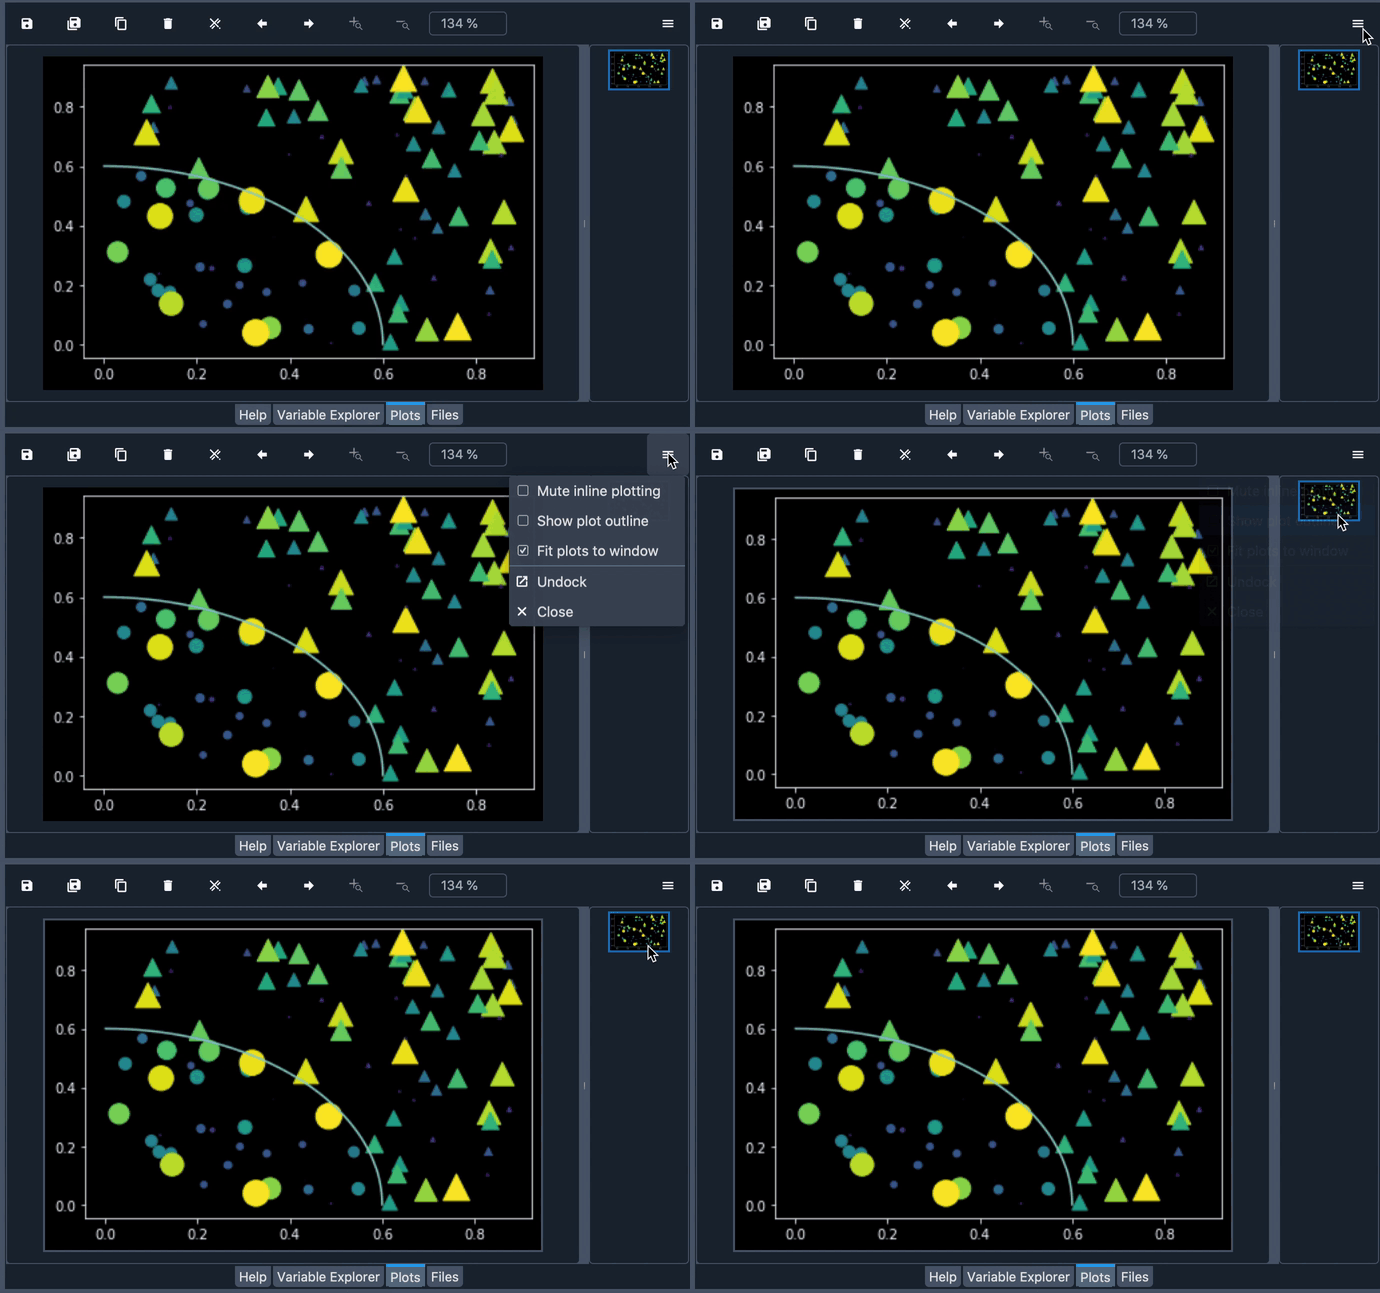
The options (“hamburger”) menu in the top right of the Plots pane offers several ways to customize how your figures are displayed.
Mute inline plotting#
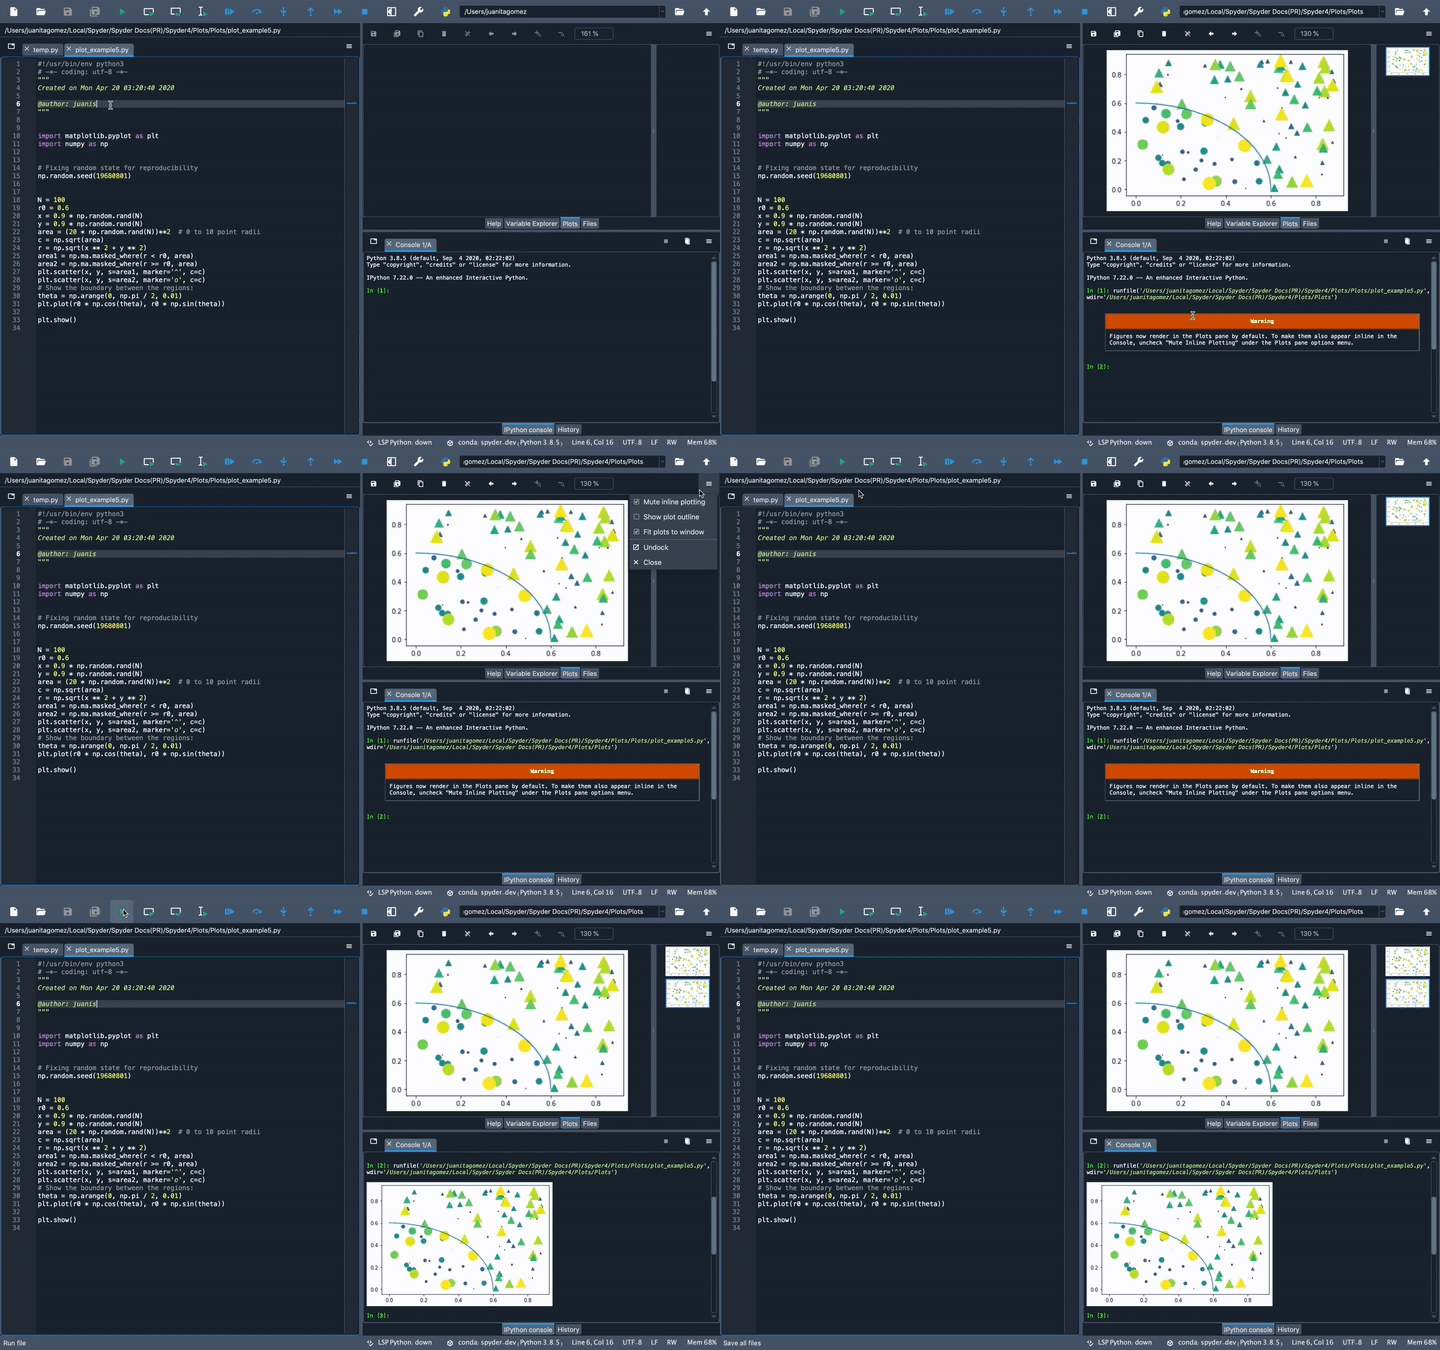
The Mute inline plotting option is enabled by default, preventing your plots from also appearing in the IPython Console. If you deactivate this option, figures will display in both the Plots pane and the console.
Show plot outline#
The Show plot outline option, off by default, shows a thin stroke surrounding the area of the figure area, which will also appear in the exported images.
Maximum number of plots#
The Set maximum number of plots option, set to 100 by default, controls how many recent plots will be accessible via the Plots pane.
A higher number means you can browse more recent plots, but will use more memory and potentially slow Spyder down substantially if you generate a very high number of plots at once.